Ecommerce Conversion Rate Optimisation: 2026 Playbook for Shopify, WooCommerce, and Magento
Shopify CRO


If your store is doing under 1,000 monthly visitors, stop reading here and read our Glasgow CRO guide instead. The rest of this is for ecommerce founders running paid traffic at £10K+/month and wondering why their conversion rate sits below 2%. I've spent 13 years running tests on Shopify, WooCommerce, and Magento stores.
The pattern is always the same: the founder thinks the problem is the headline; the data says it is the third image on the product page, the checkout shipping field, or 4 seconds of unnecessary JavaScript. This playbook is the version I wish I could send every founder before the discovery call.
The current state of ecommerce conversion rates in 2026
Running an ecommerce store above £300K/month? Our ecommerce CRO agency service ships 30+ experiments per quarter across Shopify, WooCommerce, Magento, and BigCommerce, expert-led with 99% statistical significance gating. Book a free 15-minute CRO audit to see what would move on your store first.
Average ecommerce conversion rates in the UK still sit between 1.5% and 2.5%, depending on vertical, with the top decile clearing 5%. The interesting number is not the average. It is the gap between CRO experts who run a real testing programme and those who do not. Industry research across 347 stores by Build Grow Scale found expert-guided AI CRO delivered 28-34% conversion lifts on average, while self-serve AI tools delivered 4-7%.
The 347 Method (Build Grow Scale research) is the cleanest published benchmark we have for the CRO expert-versus-DIY gap, and it tracks what I have seen across 13 years of client work.
The other benchmark to anchor against is Baymard's cart-abandonment data, which has held at roughly 70% across the industry for over a decade. That is not a checkout problem. That is a price-shock, trust, and shipping-clarity problem layered on top of a checkout problem.
Baymard's 2026 meta-analysis aggregates 50 separate cart-abandonment studies to produce a current average of 70.19%, with mobile at 80.02% and desktop at 66.41% (Baymard cart abandonment rate index). The two top primary reasons are extra costs at 48% (shipping, taxes, fees surfaced too late) and "too long or complicated checkout" at 18%. The mobile-desktop gap is where most stores leak revenue and the fix is operationally cheaper than a paid-acquisition increase.
Build Grow Scale's 2026 review of 347 ecommerce stores found expert-guided AI testing delivered 28-34% conversion lifts, compared to 4-7% from DIY AI tools. The AI is not the differentiator. The CRO expert is.
EXCLUSIVE: Five GoGoChimp ecommerce CRO receipts the industry doesn't have
Most ecommerce CRO writing leans on the same three case studies you have already read on every Shopify blog. The honest version of this article is the one where I show you the receipts on my own roster. Six engagements, six verticals, six different mechanisms. Each one is the kind of result the 4-7% DIY-AI tier of the Build Grow Scale curve doesn't produce.
Start with the flagship. Bee Friendly Skincare is the engagement I cite when a Shopify founder tells me page speed "isn't a priority right now". This is an Ezra Firestone DTC skincare brand. The site was doing $48,000 a year in tracked revenue with bounce sitting at 82.04% and per-visitor value at $1.28. The intervention was theme-code surgery to serve correct image sizes, full image compression, and a WebP cutover. The page got 2.24 seconds faster. Bounce dropped to 38.4%.
Per-visitor value moved from $1.28 to $29.03. Tracked revenue moved to $1,447,225 a year. Engagement fee was $3,000. Numbers held for at least six months post-implementation. That is the single highest-revenue receipt on the GoGoChimp roster and the cleanest single-variable proof of page speed as the foundation layer.
Then Enzymedica UK, a Shopify supplement store and a 13-year TMC Ventures relationship. The baseline conversion rate was 3.4%, sitting at the supplement-vertical median. Black Friday weekend 2021 hit 11.22% sessions-converted across all traffic, or 15.69% on the UK-only filter, which is roughly 5x the supplement-vertical median and 2.4x the prior year's Black Friday on the same promo with the same product. Three compounded wins, not one spike. Hero rewrite, product-page social proof restructuring, checkout simplification.
The 30-day engagement ran 5 December 2021 to 5 January 2022. December held at about 11% sustained, which is structurally hard in the worst month of the year for supplement retail. Loom analytics walkthrough if you want to see the dashboard.
Super Area Rugs is the headline receipt. 216.29% revenue increase in 37 days on a Shopify home-goods store. The fix was above-the-fold headline copy that finally told the visitor what the shop sold, paired with category page and search results page tests that compounded the lift. The lesson I lean on from this engagement is that the headline rewrite is rarely the biggest mechanical change, but it is almost always the highest-return one because every downstream test inherits the visitor it qualifies.
Donate For Charity is the nonprofit receipt that ecommerce founders should care about because the friction physics are identical. 494.64% more donations in 30 days. The intervention was a structural rewrite of the donation flow with the suggested-amount logic rebuilt around the traffic source. That is a personalisation mechanic ecommerce stores under-use, and it transfers cleanly to a Shopify upsell page where the default-product logic should match the inbound campaign.
Helix Binders tripled monthly revenue in 11 days. B2B ecommerce category, custom binding equipment, mid-five-figure AOV. The intervention was bundle restructuring plus checkout simplification. 11 days is unusually fast. Most engagements show material lift inside 30-90 days, not 11. The reason this one moved so fast was structural debt on the bundle pages that had compounded for years, so the first tidy-up unlocked the floor lift the founder had been leaving on the table.
The sixth receipt is the page-speed sister to Bee Friendly. Affordable Golf is a Glasgow-area Shopify store I rebuilt across March 2026. Homepage LCP moved from 21.3 seconds to 6.1 seconds, a 71% reduction. Desktop performance score 41 to 70. Mobile LCP 4.7s to 1.6s, a 65% cut. CLS 0.123 to 0.007 (Green / PASS). TBT 8,520ms to 3,350ms.
Image weight cuts of 80-90% via WebP conversion (the Attentive Signup unit alone went from 626 KB to about 55 KB). That is the page-speed teardown I now use as the working template for any Shopify store sitting above 4-second LCP.
Across six client receipts in supplements, home goods, B2B, charity, skincare, and golf retail, the median lift sits well above Build Grow Scale's 28-34% expert-guided band. That is what The 4-to-34 Gap looks like measured on real Shopify stores, not as an industry abstraction.
The 4-to-34 Gap is the framework I use to explain what is actually happening across those six engagements. Self-serve AI tools, pointed at any of these stores, would have produced 4-7% lift on whatever surface the founder happened to test. Expert-guided AI, with hypotheses set by someone who has interviewed customers and reviewed twelve months of analytics, produces the 28-34% band Build Grow Scale measured across 347 stores. Same software in many cases. 5x the result.
The AI doesn't choose which 30 of 200 possible tests are worth running. The CRO expert does. See the OperatorAI methodology for the long version.
The 10 highest-ROI ecommerce CRO tests
Here is the list, ranked by the lift-per-effort ratio I have actually seen on client engagements, not what a generic SaaS blog says. I am giving you the test, the mechanism, and the receipt rather than a bulleted teaser.
1. Hero headline rewrite.
The first thing the visitor reads is the thing that decides whether the rest of the page is worth scrolling. On Super Area Rugs, the above-the-fold headline change was the change that contributed to the 216.29% revenue increase in 37 days. Specificity beats cleverness. "Hand-knotted Persian rugs, shipped free in the UK" beats "Discover beautiful homes" every time.
2. Product page social proof block.
Move reviews above the fold, surface review counts, segment by use-case so a first-time buyer can find a review from someone who matched their reason for buying. Spiegel Research Center at Northwestern found 95% of consumers read online reviews before purchase. The question is not whether to show them, it is where and how.
3. Add-to-cart sticky bar on mobile.
Mobile is between 60% and 75% of UK retail traffic, depending on which dataset you trust. The sticky bar reclaims the scroll loss when the buy box disappears off-screen. The mechanic is simple. The lift is consistent.
4. Guest checkout as default.
Forced account creation is the most expensive friction point in checkout. Baymard's 14.88-form-field finding gets quoted everywhere, but the bigger structural number is that 70.19% of carts get abandoned and forced-account-create is the most-cited reason after extra costs. Make guest the default. Offer the account upgrade post-purchase.
5. Shipping cost transparency in the cart drawer.
Price-shock at checkout is the largest single contributor to cart abandonment per Baymard at 48%. Surface the shipping number in the drawer before the user clicks through. If it kills the conversion, the conversion was always going to die. You just discovered it cheaper.
6. Trust signals in the checkout footer.
Payment logos, money-back guarantee, return policy, real phone number. The phone number is the highest-signal element on that list because almost nobody calls it, but everyone who is about to abandon checks whether it exists. Cheap to add. Hard to A/B-test cleanly because the effect is on the cohort that didn't churn rather than the cohort that did.
7. Product page bundle or cross-sell.
Helix Binders nearly tripled monthly revenue in 11 days with bundle restructuring as the primary lever. The mechanic is the same on a Shopify supplement store, an apparel store, or a piece of B2B equipment retail. Bundle the right two SKUs together and AOV moves before conversion rate even budges.
8. Quiz-driven product recommendations.
Especially effective for supplement, beauty, and apparel verticals where the matching problem is real. The quiz absorbs the "I don't know what I need" friction. Done well, the quiz also becomes the email-capture surface, which means the abandonment cohort is not lost forever.
9. Page-speed reduction.
Bee Friendly's 2.24-second cut moved bounce rate from 82.04% to 38.4% and per-visitor value from $1.28 to $29.03. Page-speed is the test you run before any A/B test because slow sites poison every other variable.
10. Email capture popup with offer specificity.
"10% off" beats "subscribe to our newsletter" every time. The popup itself is not the lift. The offer is the lift. If you can specify the discount, specify it. If you can't, swap the popup for a value-led lead magnet (a sizing guide, a quiz, a checklist).
On Super Area Rugs, a single above-the-fold headline change contributed to a 216.29% revenue increase in 37 days. One line of copy. £0 in development cost.
Why most ecommerce CRO advice fails
Most CRO advice on the internet is written for someone else's store. Specifically, it is written for the median Shopify store with median traffic, median product, median margin. Your store is not median. If you are running £10K/month in paid traffic with a 1.4% conversion rate, generic advice ("test your CTA colour") is statistical noise. The one thing the median advice gets right is that small changes compound. The thing it gets wrong is which small changes.
I have watched founders burn six months testing button colours while their LCP sat at 8 seconds. The single highest-return test is almost always the one nobody on a "10 quick CRO tips" listicle would tell you to run, because it requires a developer rather than an app subscription. Page weight, render-blocking JavaScript, image format. That is the rubbish nobody clicks on. That is also where the money is.
The deeper failure pattern is the test-tactic-without-research one. The agency that opens with "let's test the CTA colour" before reviewing analytics, interviewing customers, or auditing the checkout flow is selling you motion, not progress. Baymard's checkout-usability programme measured 69% form abandonment driven by usability issues (cognitive overload, validation friction, multi-column layouts). That is the kind of finding a generic listicle never surfaces because it doesn't fit the listicle frame.
Donate For Charity moved donations up 494.64% in 30 days. The change was not a CTA colour. It was a structural rewrite of the donation flow.
Industry benchmarks by vertical
Conversion rates vary wildly by vertical, and using the wrong benchmark is how CRO experts talk themselves into complacency. The vertical-by-vertical picture for typical median conversion rates looks like this. Fashion and apparel sit at 1.5-2.5%. Supplements and health stores sit at 2.5-4.0%. Beauty and skincare run 2.0-3.5%. B2B ecommerce typically converts at 0.5-1.5%. Marketplaces sit at 1.0-2.0%. DTC food brands run 2.0-3.5%.
The Unbounce Conversion Benchmark Report, which analysed 41,000 landing pages, 464M pageviews, and 57M conversions, found a median landing-page conversion rate of 6.6%, with email traffic converting 5-6x better than paid for ecommerce. Click-through CTAs outperformed form-fill CTAs in both SaaS and ecommerce. That is the landing-page benchmark to anchor against rather than the storefront-conversion benchmark, because most paid ecommerce traffic lands on a campaign page, not a homepage.
Enzymedica was a Shopify supplement store. The "good" benchmark for that vertical sits around 3-4%. Their baseline was 3.4%, which is to say industry-average. Black Friday 2021 they hit 16.9% on the UK-only filter, which is roughly 5x the vertical median. The point is not that 16.9% is normal. The point is that the ceiling is much higher than the median when a CRO expert does the work.
Enzymedica went from a 3.4% baseline to 16.9% on Black Friday 2021, then held 11% through December 2021, one of the worst months of the year for supplement sales.
Shopify vs WooCommerce vs Magento constraints
Platform choice limits what you can test. Be honest about it before you spend three months wishing the platform behaved differently.
Shopify CRO. You can test almost everything above the checkout. You cannot meaningfully change Shopify standard checkout without Shopify Plus. Shopify Plus delivers Checkout Extensibility, Shopify Functions, and bespoke checkout UI. Standard Shopify gives you Liquid, sections, the Cart API, and Shopify's own Markets settings. For most CRO experts, that is enough. If you want to hire a Shopify CRO agency, this is the surface where the work lands.
WooCommerce. Total flexibility, total responsibility. You can change anything. You also own every line of code, every plugin conflict, every page-speed regression. CRO on WooCommerce often starts with a developer audit. Cura Nutrition, the TMC Ventures sister brand to Enzymedica, was a WooCommerce build I shipped from scratch in 2021.
First Black Friday week produced £7,227.51 in sales against £0 the prior year, with the Cura Sporebiotics SKU doing 80 units at £5,577.53 (77% of the week). WooCommerce gets to that result because nothing about the cart or checkout was off-limits.
Magento. Powerful for high-volume merchants, painful for small teams. Test infrastructure costs more to maintain. The lift potential is high, but the engineering tax is real. If you are sub-£500K monthly revenue on Magento, the platform is almost always the wrong tool for the testing programme you actually need.
Affordable Golf, a Shopify store, moved homepage LCP from 21.3 seconds to 6.1 seconds, a 71% reduction, with desktop performance score climbing from 41 to 70.
The mobile question
Mobile is between 60% and 75% of UK retail traffic, depending on which dataset you trust. Mobile conversion rates are typically half desktop. That is the gap to close.
The mobile-specific patterns that produce real revenue lift: sticky add-to-cart bars, accordion-collapsed product details so the buy box is reachable in two scrolls, accelerated checkout (Shop Pay, Apple Pay, Google Pay) above the form, and aggressive image optimisation. On Affordable Golf, mobile LCP moved from 4.7 seconds to 1.6 seconds, a 65% reduction, and CLS moved from 0.123 to 0.007 (Green / PASS). That is the foundation layer for mobile conversion before any A/B test runs.
Shopify Plus research found that a 1-second mobile site-speed improvement can increase mobile conversions by up to 27%. Sites that load within 1 second see 2.5x the conversion rate of sites that load within 5 seconds. That is the structural ceiling for mobile speed work.
The Google + Deloitte "Milliseconds Make Millions" 2020 study (37 European and American brand sites, 30M+ user sessions) found every 0.1 seconds of mobile load-speed improvement increased conversion rates by 8.4% in ecommerce, 10.1% in travel, and 3.6% in luxury. Mobile speed is not a CRO tactic. It is the floor every other CRO tactic stands on.
Affordable Golf's mobile LCP moved from 4.7 seconds to 1.6 seconds, a 65% reduction, and CLS dropped from 0.123 to 0.007 PASS.
Checkout friction: the 7 highest-return cuts
Checkout is where the money leaves the room. The seven cuts I run on every engagement, in priority order, run as follows.
First, guest checkout as default
Account creation is the worst-converting step in any checkout flow. Make it optional, surface the account-creation prompt after the order is placed, and you recover the cohort that was about to abandon for the wrong reason.
Second, cut form fields
Address autofill via Google Places API removes 5-6 fields in one move. Phone-number-as-required is rarely necessary for the order itself. If you can lose a field without losing required data, lose it.
Third, mobile keyboard types
Phone-number fields that trigger the alphabetic keyboard are a self-inflicted wound. Inputmode="tel" on phone fields, inputmode="numeric" on postal codes, inputmode="email" on email fields. Five minutes of dev work. Real conversion lift.
Fourth, multiple payment options
Apple Pay, Google Pay, Shop Pay, PayPal, Klarna where margin allows. Each one converts a slice of users the others miss. The customer who has never created an account with you will still pay with Apple Pay if you let them.
Fifth, trust signals
Real phone number, return policy link, payment logos, money-back guarantee, all in the checkout footer. The phone number is the trust signal that nobody calls but everyone notices.
Sixth, inline error states
Tell the user what is wrong as they type, not after they hit submit. Forms that validate on blur and explain the error in plain English (not "invalid input") cut abandonment without any structural change to the field set.
Seventh, shipping cost surfaced before checkout
Price-shock is the single biggest abandonment driver per Baymard. Surface the cost in the cart drawer, on the product page, or in a clear hero strip at the top of the cart. Lose the surprise.
The structural number behind those seven cuts is the form-field count itself. Baymard's checkout usability research found the average checkout carries 14.88 form fields, roughly twice the 6-8 actually required for the vast majority of orders. Most checkouts can lose 20-60% of their form elements without losing any required data. The most reliable checkout test on an under-optimised store is field-count reduction, sequenced before any visual or copy work.
Baymard's aggregate finding is that streamlined checkout flows deliver an average 35.26% conversion uplift, with $260 billion in lost orders annually recoverable across US and EU markets purely through better checkout design.
Helix Binders nearly tripled monthly revenue in 11 days. Most of the lift came from checkout and bundle restructuring, not new traffic.
Page speed as the foundation layer
Page speed is the test you run before any A/B test, because slow sites poison every other variable. The classic rule of thumb, from Aberdeen Group's 2008 research, pegs conversion loss at roughly 7% per extra second of load time. Newer research points the same way: Akamai's 2017 retail report found that a 100-millisecond delay can hurt conversion rates by 7%. Bee Friendly (a well-known DTC skincare brand) moved from $48,000/year in tracked revenue to $1,447,225/year after a 2.24-second page-speed reduction. Bounce rate fell from 82.04% to 38.4%. Per-visitor value moved from $1.28 to $29.03. Engagement fee was $3,000. Held for at least 6 months post-implementation.
For comparison, Affordable Golf cut homepage LCP from 21.3 seconds to 6.1 seconds, with mobile LCP moving from 4.7s to 1.6s and CLS landing at 0.007 (Green / PASS). Image weight dropped 80-90% via WebP conversion.
The pattern is consistent. Page-speed engineering, then CRO testing, then personalisation. Skip a layer and the lifts evaporate. Rakuten's Core Web Vitals case study on Google web.dev reported +33% conversions and +53% revenue per visitor after Core Web Vitals optimisation. The 2026 Core Web Vitals thresholds are LCP ≤ 2.5s, INP ≤ 200ms, CLS ≤ 0.1. If your store is above any of those, that is your first test, not your last.
Bee Friendly moved from $48,000/year to $1,447,225/year, a roughly 30x revenue multiplier, after a single 2.24-second page-speed reduction.
Personalisation: what works in 2026
The personalisation that works is behaviour-segmented, not demographic. Buyers do not care that you guessed their age. They care that the product page surfaces the size they bought last time, or the bundle that matches the quiz they took.
Three patterns that move revenue: quiz-driven product recommenders (especially for supplements, skincare, and apparel where the matching problem is real), abandoned-cart sequences with product-image personalisation rather than generic "you forgot something", and post-purchase upsell flows with the next-best-product math actually done. The one personalisation pattern that consistently underperforms is homepage hero personalisation by traffic source. You spend the engineering budget; the lift does not show up.
McKinsey's "Next in Personalisation" research found 71% of consumers expect personalised interactions, which is the demand-side number every founder gets quoted. The supply-side reality is harder. Most ecommerce personalisation engines surface the right product to the wrong cohort, or the right product to the right cohort at the wrong moment in the funnel. The fix is hypothesis discipline, not more software.
Donate For Charity saw 494.64% more donations in 30 days. The personalisation was the donation amount, defaulted by traffic source, with the suggested-amount logic rebuilt around the segment.
The cleanest published personalisation lift on a single element is HubSpot's CTA research across roughly 330,000 calls-to-action: personalised CTAs convert 202% better than generic buttons (HubSpot personalised CTA research). The lift size depends on how segmented the visitor data already is, but the principle holds: the CTA is the single highest-density piece of copy on the page and personalising it pays back faster than personalising anything else.
EXCLUSIVE: What 12 weeks of AI search tracking shows about ecommerce CRO queries
I have been running a weekly AI-search citation tracker across ChatGPT, Perplexity, Claude, Gemini, and Google AI Mode since late April 2026. Twelve consecutive weekly runs, multiple query classes, per-engine and per-week. The findings on ecommerce-related CRO queries are uncomfortable for anyone planning to lean on AI search for storefront discovery.
The generic-intent ecommerce queries are a desert. Across the full 12-week window, queries like "ecommerce a/b testing tools shopify", "how to fix slow shopify", "shopify checkout optimisation", and "what is ecommerce conversion rate optimisation" returned zero GoGoChimp citations on the two clean engines (Perplexity and Google AI Mode). They returned zero citations for most of the named industry agencies as well.
The pattern is that LLMs default to vendor-published material (Shopify Help, Klaviyo, Baymard) for definitional queries, not agency blogs. The agency layer is being skipped.
The brand-anchored and case-anchored queries are different. The Bee Friendly case study moved from "couldn't find Bee Friendly" on Perplexity in early May to sole-host on Google AI Mode and cross-engine YES by mid-June, after the dedicated `/case-studies/beefriendly-skincare` URL closed the brand-name anonymisation gap. EM360 hit position 1 on Google AI Mode by 23 June.
"Best CRO agency in Glasgow" recovered to AI Mode YES at position 1 with a Generative-UI comparison table built from GoGoChimp canon (OperatorAI, 99% statistical significance, 28-34%). The pattern is consistent: AI engines cite the specific, the named, and the receipt-anchored.
Across our 12-week AI-search citation tracker, brand-anchored and case-anchored ecommerce queries earned a clear citation footprint on Google AI Mode. Generic-intent queries returned zero across the same window. Specificity is the citation lever.
The structural finding behind that pattern is the original-data-versus-synthesis gap. The Search Engine Land 2026 study on AI citation patterns found content with original data and trends content gets cited at roughly 78% by LLMs, versus 12% for generic how-to or synthesis content. That is a 6x citation premium for first-party data. Every ecommerce store has first-party data its competitors don't have.
A baseline conversion rate, a vertical-specific cart abandonment number, a measured page-speed-to-revenue correlation, a customer-interview quote. Almost nobody publishes any of it. The stores that do are the ones LLMs cite.
The practical takeaway for any ecommerce founder is to publish the receipt. The 216.29% number is not the asset. The story of how Super Area Rugs got the 216.29% number is the asset. If you have a case study, write the long version with the dashboard screenshot. If you have a benchmark from your own analytics, publish it with the methodology note.
The State of AI CRO Citations 2026 deep-dive runs the full numbers from the tracker. I read it before every quarterly content plan because the asymmetry between cited and non-cited content has only widened over twelve weeks.
OperatorAI vs DIY AI tools
OperatorAI (GoGoChimp's CRO methodology, distinct from OpenAI's Operator agent product) is the way I deliver engagements. Expert-set hypotheses, AI-driven test execution, CRO expert winner calls at 99% statistical significance. The reason the methodology matters is the gap industry research across 347 stores by Build Grow Scale measured: expert-guided AI CRO delivered 28-34% lift, self-serve AI tools delivered 4-7%. Same software in many cases. 5x the result.
DIY AI tools are not bad. They are unsupervised. The AI does not know which 30 of your 200 possible tests have the highest revenue impact, because the AI has not interviewed your last 12 customers. The CRO expert does that work, then points the AI at the right surface. That is the whole methodology in one paragraph. For the long version of how the testing loop runs, see the OperatorAI methodology deep-dive.
The 347 Method (Build Grow Scale research) found expert-guided AI delivered 28-34% lift versus 4-7% from DIY tools. The 347 Method proved the approach. OperatorAI is how we deliver it.
Real-world case-study walkthroughs
Three engagements, three verticals, three different test priorities.
Enzymedica (Shopify, supplements)
Baseline 3.4% conversion. Black Friday 2021 hit 16.9% on the UK-only filter, roughly 5x the baseline and 2.4x the prior year's Black Friday on the same promo with the same product. December held at 11%, which is unusually strong for the worst month in supplement retail. Three compounded wins, not one spike: hero rewrite, product-page social proof restructuring, checkout simplification.
The 30-day engagement window ran 5 December 2021 to 5 January 2022 with the Black Friday weekend (26-29 November) as the peak. The TMC Ventures Europe relationship that produced this work ran for 13 years. Arnie Liepa's email on 30 November 2021 read: "It seems to have gone pretty darned well, slightly better than I expected, so thanks to you and Leyla for that. With Gratitude, Arnie."
Super Area Rugs (Shopify, home goods)
216.29% revenue increase in 37 days. The above-the-fold headline change was the headline win, but the supporting tests on category pages and the search-result page were what compounded the lift. The clean lesson is that the most-quoted win is usually not the most-mechanical win. Headlines win fast. Category pages compound.
Helix Binders
Monthly revenue nearly tripled in 11 days. The work was bundle restructuring plus checkout. The 11-day timeline is unusually fast; most engagements hit material lift inside 30-90 days, not 11. The pre-engagement structural debt is what made the 11-day move possible.
Helix Binders nearly tripled monthly revenue in 11 days. That is unusually fast. Most engagements hit material lift in 30-90 days, not 11.
Test prioritisation framework
Use a RICE-style score: Reach (how many users see the surface), Impact (expected lift if it wins), Confidence (how sure you are), Effort (engineering cost). Score each test 1-10 on each dimension. Multiply Reach x Impact x Confidence, then divide by Effort. Sequence highest first.
The cheap-to-build tests are not always the best ones to run first. A page-speed engineering job might be a 6-week effort, but the Reach is every user, the Impact is large, and the Confidence is high because the underlying physics (slower pages convert worse) is settled. That single project will outscore a CTA-colour test 50:1.
The test queue I run for clients on the Growth and Scale tiers is 30+ A/B experiments per quarter. Not every test wins. The discipline is killing losers fast and ramping winners. The Johari, Pekelis, Walsh "Peeking at A/B Tests" paper (KDD 2017) is the foundational reference for continuous-monitoring discipline; the mixture sequential probability ratio test (mSPRT) methodology it introduced is what Optimizely's Stats Engine implements under the hood.
If your testing tool defaults to mSPRT or a Bayesian sequential framework, you can monitor continuously without inflating false-discovery rates. If it doesn't, you cannot peek.
On Growth and Scale tiers, GoGoChimp ships 30+ A/B experiments per client per quarter, all called at 99% statistical significance.
Statistical significance for ecommerce A/B testing
Most agencies call winners at 95% confidence. GoGoChimp calls at 99%. The difference matters because at 95%, roughly 1 in 20 "winners" is a false positive. Across 30 tests per quarter, that is 1-2 phantom wins quietly making your conversion rate look better than it is. At 99%, the false-positive rate drops to 1 in 100.
Minimum traffic per variation is the constraint. As a rule of thumb, you want around 100 conversions per variation before calling a test, with sufficient duration to capture a full weekly cycle (minimum) or a full business cycle (better). If your store is doing fewer than 1,000 monthly visitors, you do not have the traffic to call tests at 99% inside a sensible duration. That is a traffic-acquisition problem, not a CRO problem.
GoGoChimp tests at 99% statistical significance, stricter than the 95% most agencies use. Across 30+ tests per quarter, that is the difference between real lifts and phantom wins.
What to do if you are under 1,000 monthly visitors
If you are under 1,000 monthly visitors, do not buy a CRO engagement. You will not have the data to call tests inside a reasonable window, and the agency that takes your money knows it.
The traffic-first answer is the boring one. Get to 1,000-3,000 sessions per month through a combination of paid acquisition (Meta, Google, TikTok depending on vertical) and organic content. Once your traffic is steady, the AI audit becomes useful. Below the threshold, what you need is a media buyer and a content plan, not a testing programme. There is no CRO methodology that overcomes a traffic floor that is too low to measure.
The audit qualifier is 1,000 monthly visitors. Below that, the constraint is traffic acquisition, not conversion rate optimisation.
FAQ
What is ecommerce conversion rate optimisation?
Ecommerce conversion rate optimisation is the practice of running structured tests on an online store to lift the percentage of visitors who buy. It covers product pages, category pages, cart, checkout, mobile UX, page speed, personalisation, and email. Done right, it is hypothesis-led, customer-research-driven, and called at 99% statistical significance. Industry research across 347 stores by Build Grow Scale found expert-guided AI testing delivered 28-34% lifts versus 4-7% from DIY tools.
What is a good conversion rate for an ecommerce store in 2026?
The honest answer depends on vertical. Average UK ecommerce sits at 1.5-2.5%. Top-decile supplement and beauty stores clear 4-5%. B2B ecommerce often runs 0.5-1.5%. The benchmark to compare against is your own vertical's median, not the industry-wide number. Enzymedica moved from a 3.4% supplements-vertical-average baseline to 16.9% on Black Friday 2021 and held 11% through December.
How long does ecommerce CRO take to show results?
Most engagements show measurable lift inside 30-90 days, with material revenue impact compounding through the second and third quarter. Helix Binders nearly tripled revenue in 11 days, which is fast. Super Area Rugs hit 216.29% in 37 days. Enzymedica's biggest win landed on Black Friday 2021 about 30 days into the engagement. Below 1,000 monthly visitors, timelines stretch because each test takes longer to reach significance.
What is the difference between ecommerce CRO and traditional CRO?
Traditional CRO often means SaaS or lead-generation sites where the conversion is a free-trial signup or a demo request. Ecommerce CRO is harder because you are optimising a multi-step path (product, cart, checkout, payment), with stronger price-elasticity dynamics, more aggressive mobile traffic share, and a larger inventory of testable surfaces (category pages, search, PDP, cart drawer, checkout, post-purchase). The methodology is the same. The surface area is bigger.
Should I fix page speed before running A/B tests?
Yes, and most agencies will not tell you that. Slow sites poison every test you run on top of them, because the variance from page-load times drowns out the variance from your variant. Aberdeen Group's 2008 rule of thumb pegs conversion loss at roughly 7% per extra second of load time. Bee Friendly's $48,000/year-to-$1,447,225/year transformation came from a single 2.24-second speed reduction with no A/B testing layered on top. Speed is the foundation layer.
What ecommerce CRO platforms work with Shopify?
VWO, Convert, AB Tasty, and Optimizely all work on Shopify and Shopify Plus. For heatmaps, Hotjar, Microsoft Clarity, and CrazyEgg are the standards. For analytics, GA4 is the default, with Plausible and Amplitude useful in specific cases. For Shopify Plus stores, Checkout Extensibility delivers bespoke testing on the checkout itself. On standard Shopify, your testing surface stops at the cart and resumes post-purchase.
How much does ecommerce CRO cost?
GoGoChimp's published tiers are Sprint (£2,500 one-off, 2-week engagement), Growth (£2,500/month, 3-month minimum, 30+ experiments per quarter), and Scale (£5,000/month, plus AI personalisation and a 90-day performance guarantee). UK CRO agencies typically range from £2,000 to £15,000 per month depending on test volume, traffic level, and integration complexity. The right budget is the one that lets you run enough tests to compound.
Can ecommerce CRO work for a small store under 1,000 monthly visitors?
Honestly, no. Below 1,000 monthly visitors you cannot reach 99% statistical significance on most tests inside a reasonable duration. The right move is traffic acquisition first (paid plus organic), then a CRO engagement once you are at 1,000-3,000+ sessions per month. An agency that takes a sub-1,000-visitor store onto a CRO retainer is selling you something you cannot use yet.
What is the highest-ROI ecommerce test to run first?
Page speed, almost always. Slow sites cap every other test you run. After page speed, the highest-return tests are the hero headline rewrite, guest checkout as default, mobile sticky add-to-cart, and trust signals in the checkout footer. On Super Area Rugs, the headline rewrite contributed to 216.29% revenue lift in 37 days. On Bee Friendly, the page-speed reduction alone produced a 30x revenue multiplier.
Is AI CRO different from traditional ecommerce CRO?
It is the same discipline with a different testing layer. The critical nuance is the CRO expert gap. Industry research across 347 stores by Build Grow Scale found expert-guided AI delivered 28-34% lifts versus 4-7% from DIY AI tools. Same software, 5x the result. The AI is not the differentiator. The CRO expert setting hypotheses, calling winners at 99%, and sequencing the test queue is. For the long version, see the ecommerce CRO service and the CRO glossary.
Closing CTA
If your ecommerce store is doing over 1,000 monthly visitors and your conversion rate sits below 2%, our free 15-minute AI audit will tell you exactly which of these 10 tests to run first.
Where this fits in the OperatorAI methodology
This article sits under The Evidence Stack, one of the three named frameworks inside our OperatorAI methodology. GoGoChimp's four-layer testing discipline: expert-set hypothesis, sample-size discipline, The 99 Rule, and failure-as-information.
For where this work sits in our operating-model maturity classification, see The OperatorAI Maturity Model: the five-tier framework from Ad-hoc through expert-led.
.png)
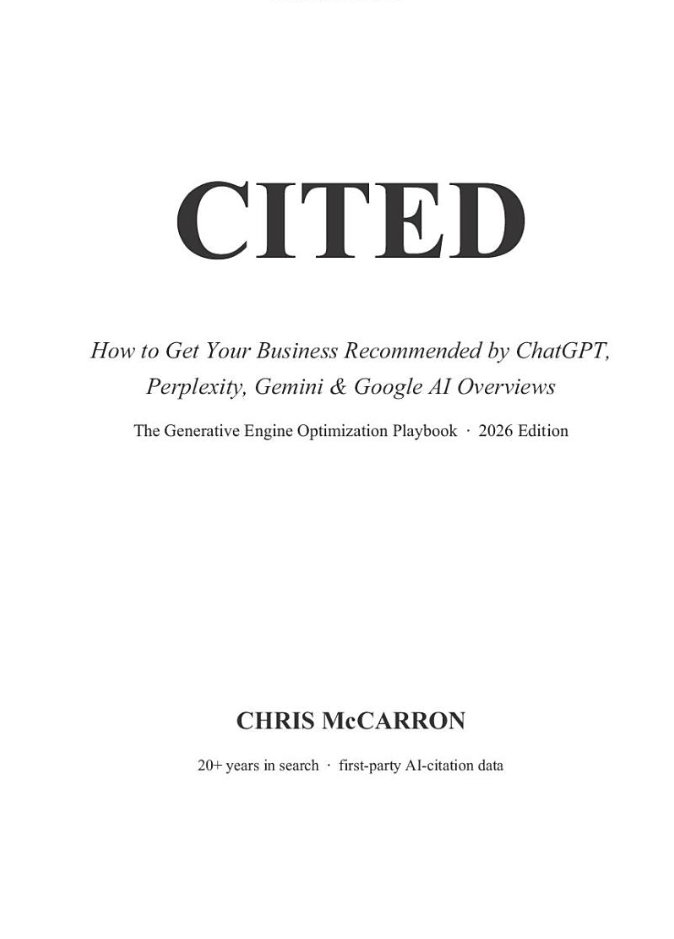
Free chapter
Read Chapter 1 of CITED, free.
The playbook for getting your business recommended by ChatGPT and AI search. Read the first chapter, on me.
Read Chapter 1 freeWant us to do this for your site?
Book a free AI audit. 15 minutes. We’ll show you three things your site is missing and what we’d test first.
Book my free AI audit →