Page Speed
How a UK Shopify Retailer Cut LCP by 15 Seconds (Affordable Golf, Annotated Teardown)
Last updated: [Updated Date]


If your Shopify store loads under 4 seconds, image weight under 3MB, and CLS green, stop reading here. The rest is for the founders staring at a 21-second mobile LCP and wondering why their Facebook ads stopped converting.
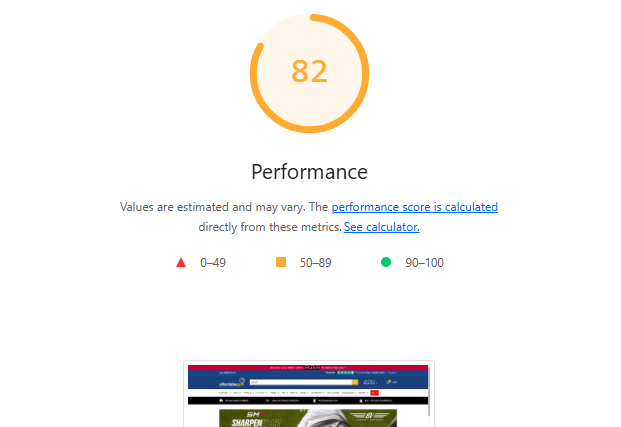
Affordable Golf's homepage Largest Contentful Paint went from 21.3 seconds to 6.1 seconds (15.2 seconds faster, 71% improvement) across March 2026; desktop performance score lifted +29 points and Cumulative Layout Shift dropped to 0.007 (PASS).
Affordable Golf is a UK Shopify retailer with a Newton Mearns store. In early March 2026 their homepage was loading the largest above-the-fold element at 21.3 seconds. Two weeks later, after Phase 1 (visual load) and Phase 2 (stability) of our page-speed engagement, that number was 6.1 seconds. Mobile LCP halved from 4.7s to 1.6s. CLS dropped from 0.123 (failing) to 0.007 (passing). Total Blocking Time fell by 5,170 ms. We did it without changing a word of copy or a single product photograph. This is the annotated teardown.
The setup
Affordable Golf is a UK golf retailer on Shopify with a physical store in Newton Mearns. Established brand, real catalogue, real organic traffic, real paid spend. In early March 2026 the homepage was loading the largest above-the-fold element at 21.3 seconds.
Homepage LCP at 21.3 seconds means most visitors are seeing a white screen for longer than the average attention span. The page wasn't slow. The page wasn't loading.
Three pages were in scope: homepage, category (Golf Drivers), and product (KING PUR Wedge). All three carried the same structural problems: oversized images served at master resolution, layout-shift on the logo and USP icons, and a third-party JavaScript layer crushing the main thread on mobile. The audit opened 5 March 2026; Phases 1 and 2 shipped over the following nine days. Public-naming permission granted 27 April 2026.
What I saw in the data first
Before any A/B test, I look at the data. I have held this rule for thirteen years and it has never lost me money.
The first number that stopped me cold was the homepage payload at 7.9 MB: roughly 5 MB of dead weight for a 2026 Shopify store. The browser was sitting idle for 1.8 to 1.9 seconds waiting for images before it could paint anything meaningful.
On a 7.9 MB page, the LCP image waits 1,820 ms to start downloading because it's competing with 5 MB of "dead weight" assets the browser has prioritised. Cut the dead weight, and the hero starts downloading almost instantly.
Second: CLS 0.123, failing Google's PASS threshold. Cause: a logo with no fixed dimensions, USP icons resizing from 60×60 to 30×30 in the browser, lazy-loaded images without explicit width/height. Third: TBT at 8,520 ms, over eight seconds of main-thread blocking from third-party JavaScript. BSS Product Label engine, Boost Commerce filter, Zendesk widget, and a doubled-up Microsoft Clarity install (legacy app + GTM container).
Three layers (payload, stability, blocking), three fix categories.

The before / after numbers, annotated
- Homepage LCP: before 21.3s, after (phases 1 & 2) 6.1s, change −15.2s (71% faster)
- Desktop performance score: before 41, after (phases 1 & 2) 70, change +29 points
- Mobile LCP: before 4.7s, after (phases 1 & 2) 1.6s, change −3.1s (65% faster)
- CLS (homepage): before 0.123, after (phases 1 & 2) 0.007, change Green / PASS
- TBT (homepage): before 8,520ms, after (phases 1 & 2) 3,350ms, change −5,170ms (~60%)
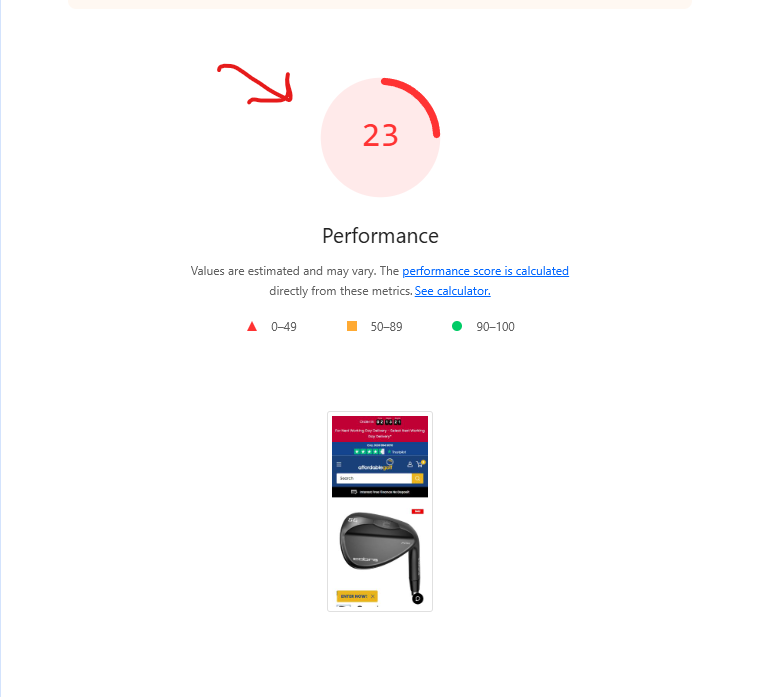
- Mobile performance score: before 26, after (phases 1 & 2) 28, change +2 (capped by 3rd-party JS)
- Total page weight: before 7.9 MB, after (phases 1 & 2) <3.0 MB target, change ~5 MB removed
- Attentive Signup Unit: before 626 KB, after (phases 1 & 2) ~55 KB, change −91% (WebP)
- Heading SVG (homepage): before 141 KB, after (phases 1 & 2) ~42 KB, change −70% (WebP)
- Mobile PW Banner: before 129 KB, after (phases 1 & 2) ~38 KB, change −71% (WebP)
- Cobra Logo / Wedge 1 (product): before 39.3 KB, after (phases 1 & 2) ~14 KB, change −64% (WebP)
- Fully Loaded Time (homepage): before 34.1s, after (phases 1 & 2) <10s target, change −24s
The headline number is the homepage LCP. The honest number is the mobile performance score. Phase 3 is what closes that gap.
---
Principle 1: WebP is not optional in 2026
WebP lossy images are roughly 26% smaller than equivalent JPEG and 80-90% smaller than uncompressed PNG/SVG at master resolution. On Affordable Golf the Attentive Signup Unit went from 626 KB to ~55 KB (91% reduction); the heading SVG/PNG went from 141 KB to 42 KB (70% reduction). Multiplied across a homepage carrying 30+ image assets, the cumulative effect is a different page entirely.
Image format alone moved Affordable Golf's homepage payload from 7.9 MB toward a sub-3 MB target. WebP isn't a marginal saving. It's the line between a page that loads and a page that doesn't.
Modern browsers (Chrome, Edge, Firefox, Safari from version 14 onward) support WebP natively. Shopify's image pipeline serves a JPEG fallback for the long-tail. There is no defensible reason for a 2026 Shopify store to be serving 600 KB PNGs.
Principle 2: identify the LCP element, then optimise it specifically
The LCP element is the largest above-the-fold image, video, or text block. On Shopify it's almost always the hero banner (homepage), the first product tile (category), or the main featured image (product).
You cannot optimise LCP generically. You optimise the specific element. On Affordable Golf the homepage hero was the first slide of a Slick carousel, and the carousel was lazy-loading every slide, including the first. The fix in slideshow.liquid: strip lazyload from slide one, remove the bgset requirement, add fetchpriority="high". On the product page, the equivalent fix in product-gallery.liquid was isolating the first image with forloop.first, converting data-src to src, and adding fetchpriority="high" plus loading="eager". That single change cut homepage LCP by several seconds before any image-format work landed.
Principle 3: the critical render path runs on bytes, not minutes
Browsers paint in a fixed order: HTML parses, CSS blocks rendering until it loads, JavaScript blocks parsing unless deferred, and images queue against browser heuristics.
Affordable Golf's product page LCP was waiting 770 ms for CSS files to download before the browser even started the LCP image request. A
<link rel="preload">injection collapses that delay by fetching the image in parallel.
Render-path fixes shipped:
- Preconnect / dns-prefetch for
cdn.shopify.com,cdnjs.cloudflare.com,ajax.googleapis.com,static.zdassets.com. Saves 200-400 ms. <link rel="preload">for hero banner and first product image. Bypasses the CSS-blocked queue.- Print-media CSS deferral for Slick Slider and Boost Filter (
media="print" onload="this.media='all'").
Each fix is small. Stacked, they re-sequence the entire critical path.
Principle 4: third-party JavaScript is what kills mobile performance
Desktop CPUs absorb JavaScript bloat. Mobile CPUs do not. This is why desktop jumped 29 points while mobile barely moved 2.
The audit found 47+ apps installed, well above the 3-5 essential apps that successful Shopify stores typically run (per Shopify's app performance best practices). The worst offenders:
- TA Labels & Badges: 6.7 seconds of mobile main-thread execution.
- BSS Product Labels: 3.0 seconds of TBT, deferred during Phase 2.
- Microsoft Clarity: installed twice (legacy app and GTM container, both firing).
- Zendesk widget: double-loaded (legacy script + GTM tag), ~1.5 seconds of blocking.
- Hextom Timer Bar: 3.7 seconds for what most themes do natively.
Phase 2 deferred BSS until after DOMContentLoaded, dropping TBT by ~3 seconds in isolation. Phase 3 moves the remaining apps into a GTM interaction-listener (fire only after the user first taps), reclaiming an estimated 10 seconds of mobile main-thread time.
80% of the remaining mobile load time on Affordable Golf is third-party app code that bypasses theme controls. The fix isn't in the theme. It's app consolidation, GTM interaction-listener migration, and ruthless removal of duplicate functionality.
Principle 5: the 7% rule (Akamai)
Akamai's research: a one-second delay in load time reduces conversions by roughly 7%. The rule isn't linear at the extremes. It compounds.
On a 21-second homepage, the 7% rule predicts a conversion floor at near-zero, and the bounce-rate signature confirms it. Cutting LCP from 21.3s to 6.1s doesn't just delivers 15 × 7%. It delivers the population of visitors who now stay long enough to engage at all. That's why this case (and our BeeFriendly page-speed case study on a US store from 2017) both produced revenue effects far larger than linear arithmetic predicts.
Principle 6: CLS is the cheapest Core Web Vitals win
CLS measures how much the page jumps around as elements load. Google's PASS threshold is 0.1 or below. Affordable Golf moved from 0.123 (failing) to 0.007 (passing) in less than a day of theme-code work. Three root causes:
- Logo with no fixed height. Pushed the header down once it loaded. Fix: hardcoded
width/heightcalculated fromlogo_max_widthaspect ratio inheader.liquid. - USP icons resizing in the browser. 60×60 source pulled into 30×30 slots. Fix: serve 30×30 directly with hardcoded
width="30"andheight="30"intext-with-icons.liquid. - Lazy-loaded images without dimensions. Grid re-flowed on each paint. Fix: CSS rules forcing fixed dimensions, plus
width/heighton every<img>.
Web fonts are the other common CLS contributor; Affordable Golf's font stack was already configured with font-display: swap and aspect-ratio fallbacks, so the CLS work focused on images, USP icons, and the header logo.
CLS 0.123 0.007 is three fixes that take less than a day. Most Shopify stores have all three problems. Most CRO agencies never look.
Principle 7: INP is the responsiveness metric agencies still ignore
INP (Interaction to Next Paint) replaced FID as Google's third Core Web Vital in March 2024. It measures the worst delay between a user tap or click and the next visual update.
INP is a different problem from LCP. A page can hit a perfect 1.5s LCP and still feel broken if INP is 800 ms because the main thread is locked up by a click handler. Affordable Golf's TBT (8,520 ms before, 3,350 ms after) is the closest proxy reading we have: blocked main thread means queued taps means bad INP. The source docs do not state explicit INP measurements, so TBT carries the responsiveness signal here. Phase 3 is what drives INP into the green band, because the apps responsible for TBT are also the apps responsible for laggy menu, filter, and add-to-cart taps.
Principle 8: measure mobile first, always
UK retail Shopify mobile traffic typically sits between 60% and 75% of total sessions. Mobile is also where third-party JavaScript hits hardest because mobile CPUs cannot absorb the work.
Most agencies cite the desktop score because it's prettier. The desktop score is not what your majority visitors experience. Affordable Golf's desktop score (41 70) is the headline. The mobile score (26 28) is the truth. That gap is also why Phase 3 is the part that matters most for revenue.
Principle 9: phase-based delivery beats big-bang rebuilds
When the audit identifies three different problem categories (payload, stability, main-thread blocking) the wrong move is to ship them all at once. Phasing makes each phase's contribution measurable in isolation.
- Phase 1: Visual load. WebP conversion, image resizing, hero preload, slideshow and product-gallery prioritisation. LCP from 21.3s toward ~10s.
- Phase 2: Stability. Hardcoded dimensions, CSS aspect-ratio defence, BSS Product Label deferral. CLS to PASS, additional LCP/TBT gains.
- Phase 3: Third-party JS cleanup. App consolidation, GTM interaction-listener migration, dead-Liquid removal. Pending developer intervention.
Phasing protects against regression. If Phase 2 had broken something, the cause was Phase 2, not a Phase 1 image conversion. Big-bang rebuilds make root-cause diagnosis impossible at 11 PM on a Friday in November.
Phase-based delivery protects a Shopify store doing real revenue. Each phase ships, regression-tests, and contributes a measurable share of the total lift. Big-bang rebuilds are a feature of agencies that don't carry the on-call pager.
Principle 10: page speed is the delivers layer, not the conversion layer
A 15.2-second LCP improvement is not a 15.2 × 7% conversion lift. It is the delivers that makes every other CRO lever (copy, layout, offer, A/B testing) worth running.
This is the connection point with industry research across 347 stores by Build Grow Scale, what we call The 347 Method. Stafford's 2026 review found expert-guided AI CRO delivers 28-34% conversion lift versus 4-7% from self-serve AI tools. The expert-guided differential exists because operators know to fix LCP before running a button-colour test. Self-serve AI does not.
The 347 Method proved the approach. OperatorAI (GoGoChimp's CRO methodology, distinct from OpenAI's Operator agent product) is how we deliver it. Page speed is the first layer in the stack; the AI CRO layer sits on top once visitors can actually load the page.
---
How to apply this to your own Shopify store
Don't copy Affordable Golf's specific fixes. Copy the framework.
- Run PageSpeed Insights mobile, read mobile LCP first. Over 4 seconds means you have a page-speed problem regardless of your desktop score.
- Identify your LCP element on each page type. Homepage hero, category first tile, product main image. Mark each with
fetchpriority="high"and ensure none are lazy-loaded. - Run a payload audit. Total page weight over 3 MB in 2026 is a smell. Convert worst offenders (hero, popup, banner, icons) to WebP.
- Audit your CLS contributors. Logo without fixed dimensions, USP icons resizing, lazy-loaded images without
width/height. Theme-code fixes, none take more than a day. - Rank apps by main-thread execution time. Anything over 1 second is a candidate for removal, GTM-migration, or interaction-listener loading. Shopify's cap is 20.
- Phase the work. Visual load, stability, third-party cleanup, in that order. Don't ship all three in one push or you can't attribute the lift.
- Report revenue per visitor, not PageSpeed score. The score is cause; revenue is effect. CFOs fund effect.
Run the framework yourself or run our free AI audit and we'll do the diagnostic for you.
---
Frequently asked questions
What was Affordable Golf's homepage LCP improvement?
Homepage LCP moved from 21.3 seconds to 6.1 seconds across Phases 1 and 2: a 15.2-second reduction (71% faster). Desktop performance score lifted from 41 to 70 (+29 points). Mobile LCP fell from 4.7 to 1.6 seconds (65% faster).
What does CLS 0.007 mean?
Cumulative Layout Shift measures visual stability during load. Google's PASS threshold is 0.1 or below. Affordable Golf moved from 0.123 (failing) to 0.007 (PASS) via hardcoded image dimensions, aspect-ratio defence on the logo, and explicit width/height on USP icons.
How much does WebP conversion save on Shopify image weight?
80-90% file-size reductions on the worst-offender assets. The Attentive Signup Unit dropped from 626 KB to ~55 KB (91%). The heading SVG/PNG dropped from 141 KB to 42 KB (70%). Total page weight target moved from 7.9 MB toward under 3 MB.
Why did mobile performance score barely move (26 28) when desktop jumped +29?
Mobile score is suppressed by third-party JavaScript that requires developer intervention. Microsoft Clarity, Zendesk widget, BSS Product Labels, TA Labels & Badges, and Hextom Timer Bar all load on the main thread and freeze the mobile CPU during render. Desktop CPUs absorb the load; mobile CPUs cannot. Phase 3 targets these scripts.
What is the 7% rule in page-speed CRO?
Akamai's research: retailers lose roughly 7% of conversions for every additional second of page load time. On a 21-second homepage, that compounds. Most visitors never see the page render. Cutting 15 seconds doesn't just delivers 15 × 7%. It delivers the population of visitors who now stay long enough to engage at all.
What is the difference between LCP, CLS, TBT, and INP?
LCP (Largest Contentful Paint) measures when the biggest above-the-fold element finishes rendering. CLS measures layout jump during load. TBT (Total Blocking Time) measures main-thread block time. INP (Interaction to Next Paint) replaced FID in March 2024 as Google's responsiveness metric: the worst delay between a user tap and the next visual update.
Should I run A/B tests before fixing page speed on a Shopify store?
No. If your homepage takes 21 seconds to render, your A/B tests are running on a corrupt sample. Most visitors leave before any variant loads. Fix LCP and CLS first, then test copy, layout, and offer. Running tests on a slow site is the most common waste of CRO budget I see.
---
Over to you / Next step
If your Shopify store is loading in over 4 seconds on mobile, has 30+ apps installed, and your team is running A/B tests on a homepage that hasn't been audited for Core Web Vitals, the first £2,500 of CRO budget is being wasted on the wrong layer.
Our free AI audit returns your current LCP/CLS/TBT/INP across mobile and desktop, a ranked list of your highest-return fixes, projected revenue lift before any engineering budget commits, and the three apps you should remove this quarter.
If your numbers are anywhere close to Affordable Golf's, the conversation is worth having.
Related services: page-speed optimisation | Shopify CRO | AI-powered CRO | our methodology
---
Where this fits in the OperatorAI methodology
This article sits under The 99 Rule, one of the three named frameworks inside our OperatorAI methodology. GoGoChimp's discipline of calling A/B test winners only at 99% statistical significance instead of the industry-default 95%, dropping false-positive rate from 1-in-20 to 1-in-100.
Free chapter
Read Chapter 1 of CITED, free.
The playbook for getting your business recommended by ChatGPT and AI search. Read the first chapter, on me.
Read Chapter 1 freeWant us to do this for your site?
Book a free AI audit. 15 minutes. We’ll show you three things your site is missing and what we’d test first.
Book my free AI audit →