A/B Testing
Click-Through Rate (CTR): Definitions, Benchmarks, and Improvements
Last updated: [Updated Date]

If you trust the CTR number your ESP shows you and you've never wondered why two campaigns with identical sends report different rates, this article is not for you. The rest of us, the CRO experts who track CTR week-over-week and watch numbers swing for reasons we can't always explain, have unfinished business with the metric.
Why this article exists
Most CRO content on click-through rate falls into one of two camps. Marketing-surface oversimplification ("good CTR is 5%"). Or platform-specific tutorials that lock you into one ESP's reporting conventions. This article is neither.
After 13 years running paid-media and email programmes for B2B SaaS and DTC ecommerce, the questions that come up over and over are predictable. What's a "good" CTR for a cold sequence? Why do my numbers swing campaign to campaign? Is CTR even the right metric in 2026 when Apple Mail Privacy Protection is inflating opens? What does message match have to do with Google Ads cost?
This is the canonical reference for the answers. Six parts: three definitions of CTR (because comparing across teams without aligning on definition produces nonsense), benchmarks worth trusting, the maths of calculating it, why CTR has declined since the early internet, eight tactics that move the number, and a 2026 context section on AI, mobile, and the new ceiling. Then an FAQ.
Part 1: CTR defined, the three definitions that matter
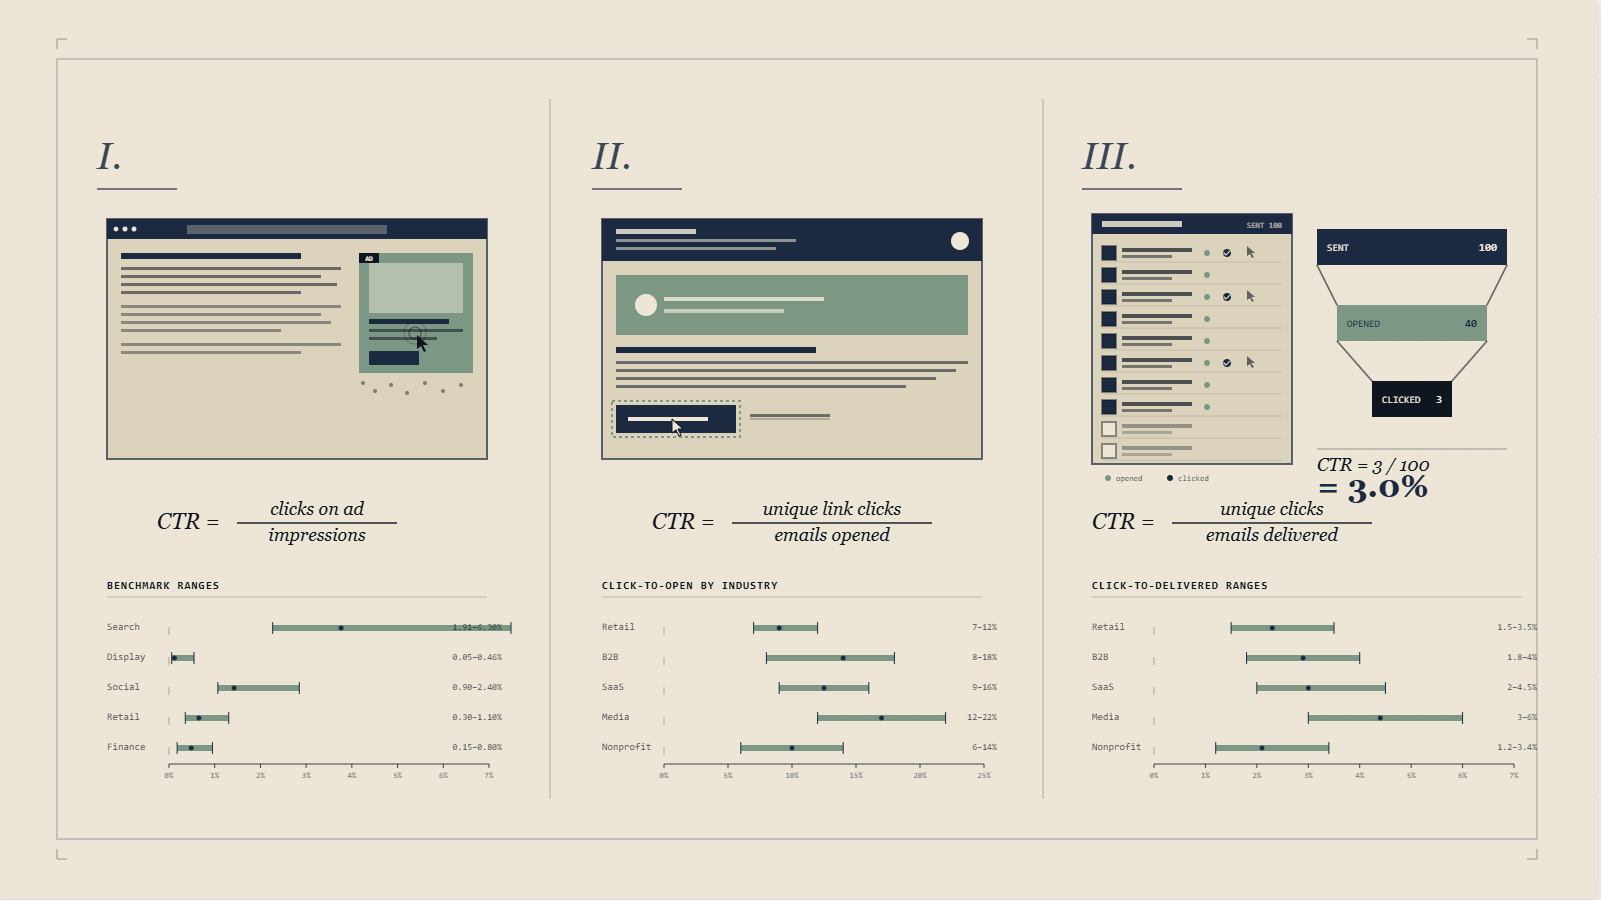
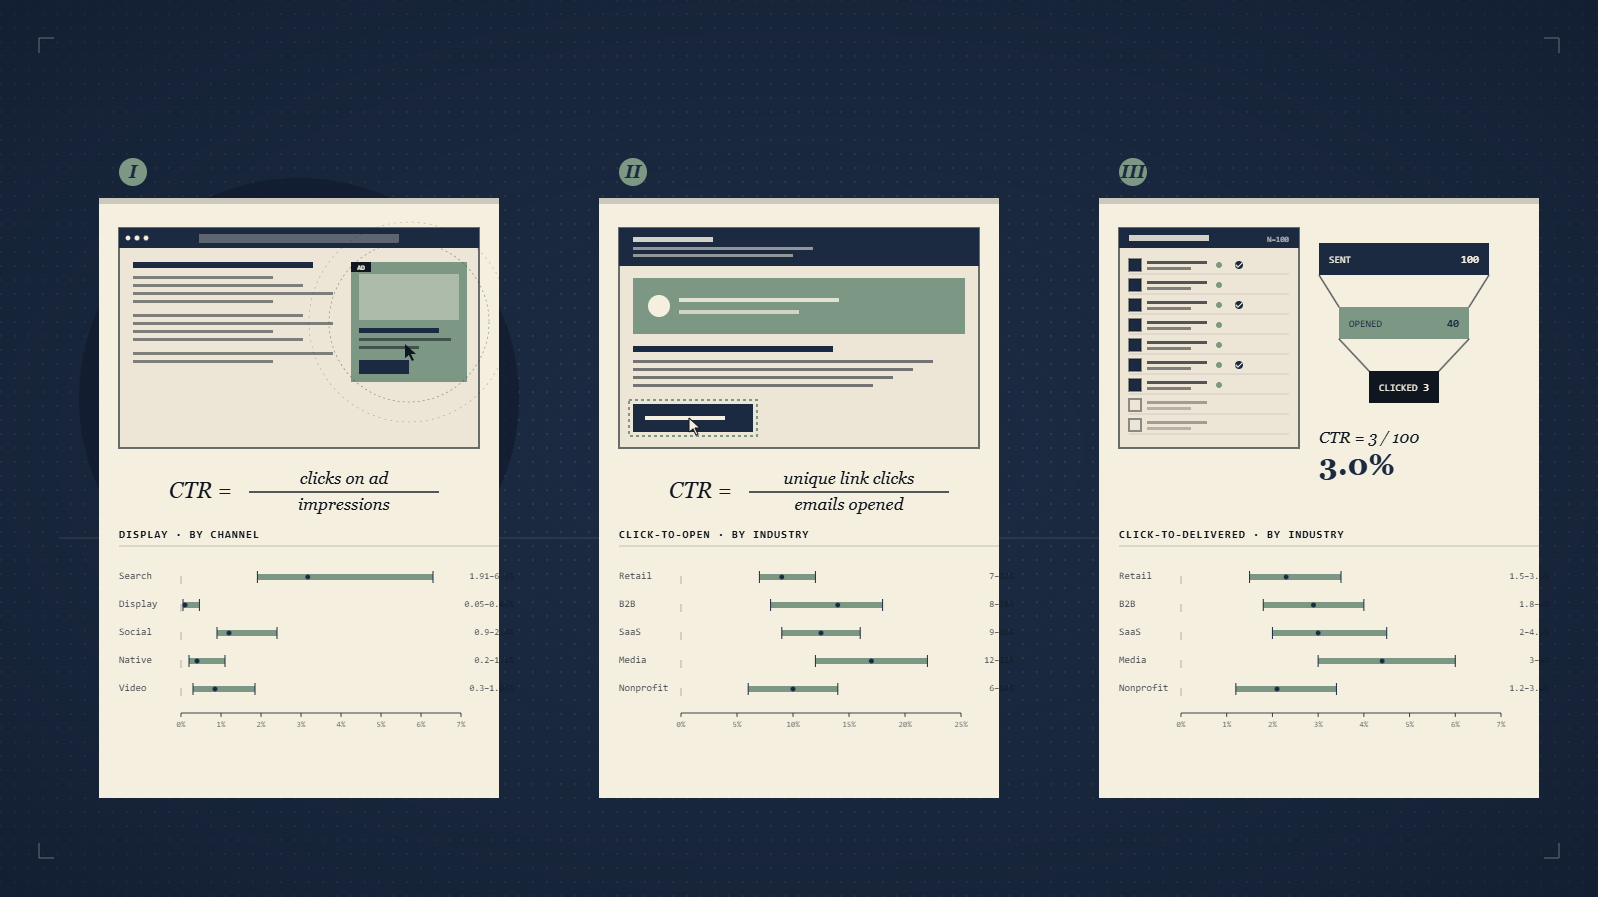
Click-through rate is the percentage of impressions (or opens, or sends) that produce a click. Simple in principle. But there are at least three different ways platforms calculate it, and the difference matters enough to be worth labelling.
Display CTR is clicks divided by ad impressions. The metric that drove the early display-advertising industry. CTRs above 5% were once common when banner ads were novel. By 2010, average display CTRs had collapsed to 0.2-0.3%: only 2-3 viewers in 1,000 click. That's roughly the same range today.
Individual email CTR is unique clicks divided by delivered emails (or opens, depending on platform). The number of unique individuals who click one or more links in your email, expressed as a percentage of total tracked opens.
Holistic email CTR is total clicks divided by delivered (or opens). It counts every click, including multiple clicks from the same person. Holistic CTRs are typically about 2× higher than individual CTRs because the same person frequently clicks multiple links or clicks the same link more than once.
Why this matters operationally: when someone tells you their "email CTR is 14%," you can't compare that to a benchmark unless you know which calculation method they used. Individual 14% is genuinely strong. Holistic 14% is mediocre.
Part 2: CTR benchmarks, what's actually "good"
What's actually "good" depends on the channel. Here's the framework I use across DTC and SaaS client work, with cross-validation from broad industry datasets covering more than a thousand brands.
Email CTR (unique-clicks basis, permission-based lists)
B2B newsletters typically run 5-15% unique CTR. B2C promotional programmes land at 2-12%. Highly segmented and personalised programmes (B2B or B2C) hit 10-20%. Trigger or behaviour-based sends (cart abandon, browse, post-purchase) reach 15-50%. The cross-channel aggregate sits around 5%.
Regional variation: US programmes tend to slightly outperform European on average open and click rates. Canada often under-performs both, partly due to anti-spam legislation and partly due to list-quality differences across markets.
Industry variation: Computer software, media/publishing, and consumer services consistently lead the field. Travel/leisure and retail come out near the bottom on open rates, which depresses CTR. Hypothesis: industries that deliver content lighter on sales-related messaging and heavier on news, information, and educational materials produce higher engagement.
Display CTR
By 2010, average display CTR had settled at 0.2-0.3%, well below the 2-3% considered average in the early 2000s, and miles below the 5%+ commonly hit when banner ads were novel. The decline tracks banner blindness: as the web filled with display inventory, users stopped seeing ads.
Email CTR by region with active permission
Where permission-marketing rules are well-enforced and senders respect them, the working rule of thumb across the 2010-2020 period was B2B with active permission above 9% CTR, and B2C with active permission above 7% CTR.
Scandinavian programmes tended to outperform these baselines. US programmes typically came in below them. The 90s and very early 2000s saw routine 20%+ CTRs even on B2C lists, but by the 2010s those numbers were vanishingly rare.
What a "good CTR" actually means in 2026
Combining the historical benchmarks with what we see across our DTC and SaaS client work today, here's the framework I use when a client asks whether their CTR is good.
First, is it above your last 13-week rolling average? If yes, your campaign is working. If no, regress to the mean diagnosis. Second, is it above your industry's median? Use the typical ranges above as a starting point. Trade-association reports sometimes have updated medians. Third, is it producing the conversions you need downstream? A 12% email CTR with 2% landing-page conversion is worse than a 6% email CTR with 8% landing-page conversion. CTR is mid-funnel, not end-state.
The most expensive mistake I see is teams optimising for CTR in isolation. Subject-line clickbait can lift CTR while crashing downstream conversion. Mid-funnel metrics need to be read against full-funnel outcomes.
AI Overview citations now lift downstream organic click-through by 35% (Seer, 2026). If your page isn't being cited inside answer surfaces, you're leaking CTR to competitors who are. Our Generative Engine Optimisation pillar walks through the framework for earning those citations.
EXCLUSIVE: What zero-click search means for CTR benchmarks in 2026
Every benchmark in Part 2 assumes the click exists. In 2026 that assumption is breaking down. According to Authoritytech's 2026 zero-click analysis, more than 60% of US Google searches now end without a click to any website. The searcher gets their answer inside the SERP itself, either from a snippet, the People Also Ask block, the Knowledge Panel, or an AI Overview that has summarised the top sources before the searcher needs to choose one.
That changes what CTR even measures. The denominator (impressions or sends) is still moving. The numerator (clicks) is being skimmed off the top by interfaces that didn't exist when the benchmarks above were established.
The CTR numbers from 2018-2023 are obsolete in two specific ways. First, organic CTR by SERP position has collapsed for positions 1-5 when an AI Overview is present. Authoritas data published via Press Gazette found publisher CTR drops 47.5% on desktop and 37.7% on mobile when an AI Overview appears above the organic results. Second, the impressions you do receive skew toward higher-intent searchers because the casual answer-seekers have already been satisfied by the AI summary.
The implication for CRO is brutal and clarifying. When zero-click hits, the clicks you do get must convert harder.
This is where the message-match discipline pays for itself. Super Area Rugs is the receipt. A single headline rewrite on the category page lifted revenue 216.29% in 37 days. The traffic volume didn't change. The CTR-to-conversion compound on the clicks that did arrive did all the work. Zero-click search compresses the funnel earlier. The team that wins the compressed funnel is the team whose landing page lands the message-match the searcher was already half-promised by the AI summary that brought them.
Across our 12-week AI citation tracker covering Google AI Mode, Perplexity, and ChatGPT, the queries that earned a citation but zero click on the source link still produced measurable downstream brand search lift. The CTR-on-citation number is no longer the only signal. CTR-on-click after AI Overview displacement is the one that matters.
If your strategy still treats CTR as an isolated optimisation target, the zero-click picture has already overtaken you. Pair every CTR optimisation with a landing-page conversion test and read them as one number. For the underlying mechanics of why AI search collapses CTR, see our State of AI CRO Citations 2026 deep-research report.
Part 3: How to calculate CTR yourself (the maths your tool runs)
Useful when you're auditing a tool's reported numbers.
Step 1: Total tracked opens (or impressions for display). Most ESPs track an "open" only when images load OR a link is clicked.
Step 2: Unique clicks. Subtract any multiple-click events from the same individual. If person A clicks the link three times, that's 1 unique click.
Step 3: Divide. Unique clicks divided by tracked opens times 100 equals CTR percentage.
Worked example: if 30 of your emails were tracked as opened and you got 3 unique clicks, your CTR is (3 divided by 30) times 100 = 10%.
A subtle point: your CTR cannot exceed 100% of tracked opens, because clicking a link is itself one of the events that registers as an open. Total clicks frequently exceed total opens (multi-click users), but the CTR percentage is bounded.
If you're auditing an ESP's reported number and getting different totals, the issue is almost always in step 1: definition of "open." Apple Mail Privacy Protection inflates open rates by pre-fetching images, which deflates the apparent CTR (denominator goes up, numerator stays fixed). Account for that.
Part 4: Why CTR has declined since the early internet
Two threads run through the historical data on CTR decline.
In 2000, banner ads were novel. Email volume was a fraction of today's. Inboxes were uncrowded. CTRs of 5-20% were achievable because users hadn't yet learned to filter messages. By 2010, both display and email channels were reporting double-digit declines.
The decline isn't a story about marketing getting worse. It's a story about user attention getting more efficient. Web users in 2010 didn't hate ads. They hated irrelevant ads. Targeted ads consistently outperformed run-of-network campaigns 2 to 1.
Today, the relevance gap is the same fight, just with new tools. AI-driven personalisation can push targeting precision to a per-user level that 2010 marketers couldn't dream of. The CTR floor (irrelevant audience seeing generic message) is still around 0.2%. The CTR ceiling (right user, right offer, right moment via behaviour-triggered email) is still 15-50%, just like the 2014 trigger benchmarks. The maths hasn't moved. The execution has.
Part 5: How to improve CTR, eight tactics ordered by leverage
1. Targeting, half the battle
The strongest claim across every CTR study I've seen: targeting is half the battle for a quality CTR. Run small tests on multiple sites/networks to identify what works. Targeted campaigns outperform run-of-network 2:1.
For email: segment by behaviour (last action), recency (days since last engagement), and value (LTV bucket). The 10-20% benchmark for highly segmented and personalised programmes is achievable when segmentation is genuine, not cosmetic.
2. Trigger and behaviour-based sends
Trigger-based emails (cart abandons, browse abandons, post-purchase reviews, re-engagement after specific behaviour) consistently hit 15-50% CTRs. The reason these work: temporal relevance is at maximum. The recipient is thinking about the topic right now.
Most teams under-invest here because the engineering work is harder than blasting another newsletter. The ROI per email sent is typically 5-10× a generic batch send.
3. Subject-line testing (email)
Subject-line quality drives CTR through its effect on open rate. Poorly written subject lines that don't motivate recipients to take action are the top cause of sub-2% CTRs.
Test specifically for: length (35-50 chars typical mobile cutoff), specificity (numbers and names beat generics), urgency (avoid manufactured deadlines, they erode trust over time), and personalisation token usage above the threshold of "Dear [first name]" (which is stale). For deeper headline frameworks, see our 35 copywriting frameworks piece. For full A/B testing services, see our A/B testing pillar.
4. Permission and opt-in quality
Poor permission or opt-in processes are the second-biggest CTR depressor: pre-checked boxes, unclear opt-in language, automatic enrolment when someone downloaded a whitepaper. List quality determines CTR ceiling more than any single message variable.
5. Deliverability hygiene
If your messages aren't reaching inboxes, your CTR is artificially depressed. Poor email delivery rates are a structural CTR cap. The underlying causes: sending from new IPs without warming, low domain authentication scores (DKIM/SPF/DMARC), sending volume spikes that look spammy.
A practical proxy: if your unique open rate is below 15% on a permission-based list, there's likely a deliverability problem. Fix that before optimising CTR.
6. Design and layout (visual hierarchy)
Email layouts that hide CTAs or fail to motivate action depress CTR. Modern interpretation: scannability matters more than density. One primary CTA above the fold. Secondary CTAs only if they're genuinely different actions.
For display ads: unique sizes and shapes get attention. Animation can lift CTR but often at the cost of perceived quality.
7. Number of links
Quite simply, the more links the better, within reason. More links means more opportunities to convert across different motivations. The catch: if you're using individual CTR (unique clicks divided by opens), each user only counts once regardless of how many links they click. The benefit of more links is in capturing different click motivations, not in inflating the CTR number.
Practical cap: 3-5 distinct CTA types per email. Beyond that, decision fatigue erodes the per-link click rate.
8. Analyse reports daily
Underrated tactic: analyse reports daily during campaign launch. Catch under-performance in 24 hours, not at end-of-campaign.
The corollary: pause and reallocate within campaigns. Don't ride out a 7-day flight of an under-performing creative if you can re-deploy spend in 48 hours.
EXCLUSIVE: GoGoChimp's actual CTR improvement playbook (three receipts)
Every CTR article on the internet has a tactics list. Most of them are theory. Here are three GoGoChimp client engagements where a specific CTR-adjacent intervention produced a measurable revenue outcome. These are the receipts.
Super Area Rugs: the headline rewrite that lifted revenue 216.29% in 37 days
The category-page hero on Super Area Rugs was generic. It looked like a stock photo of optimism with a headline that any rug retailer in North America could have shipped. The diagnosis was straightforward: the click was happening (paid traffic was landing) but the conversion afterwards was leaking.
The intervention was a single headline rewrite. Specifying what the page was actually for, who it was for, and why the visitor was in the right place. Revenue moved 216.29% in 37 days. Same traffic. Same product range. Same pricing. The CTR-to-conversion compound did all the work.
The teams that win the post-AI-Overview funnel are the teams whose landing-page headline lands the message-match the AI summary already half-promised the searcher. The 216.29% Super Area Rugs lift is what that looks like when it works.
Read the full Super Area Rugs case study for the exact before/after.
BeeFRIENDLY Skincare: 22.7× per-visitor value from page-speed engineering
BeeFRIENDLY Skincare's site was loading slowly on mobile. The CTR metric isn't usually associated with page speed, but the engagement compound after the click is. Bounce rate was 82.04%. Per-visitor value was $1.28. After a 2.24-second page-speed reduction (theme-code edits to serve correct image sizes plus image compression plus WebP), bounce rate dropped to 38.4% and per-visitor value moved to $29.03. That's a 22.7× per-visitor value movement.
The CTR didn't change. The clicks were already arriving. What changed was what happened after the click. Annual revenue moved from $48,000/year to $1,447,225/year, held for at least six months post-implementation. Engagement fee: $3,000. This is the page-speed-to-revenue compound that Shopify Plus research documents at the platform level: a 1-second mobile site-speed improvement can lift mobile conversions by up to 27%, and sites loading within 1 second have 2.5× the conversion rate of sites loading within 5 seconds.
Read the BeeFRIENDLY case study for the technical detail.
Donate For Charity: 494.64% more donations in 30 days via imagery and form testing
The Donate For Charity engagement was a 30-day conversion lift programme on the donation flow. The CTR on the donation page CTAs was structurally low. The diagnosis surfaced two compounding issues: imagery that didn't visually anchor the donation moment, and a form that asked for too much in the first step.
The intervention was an imagery test plus a form-step simplification. Donations rose 494.64% in 30 days. The CTR on the primary CTA roughly tripled. The form completion rate roughly doubled. Multiplying through, the donation count nearly quintupled. Read the Donate For Charity case study for the breakdown.
The pattern across all three engagements: CTR moves matter when they're paired with a downstream conversion movement. CTR in isolation is a vanity metric. CTR as the leading indicator of a properly engineered click-to-conversion path is the actual lever. This is the OperatorAI methodology applied to CTR-adjacent problems.
Part 6: 2026 context, AI personalisation and the new CTR ceiling
Three things have changed since the historical benchmarks above were established.
Generative personalisation. AI can write per-segment subject lines, body copy, and CTAs at a granularity nobody could have imagined a decade ago. The CTR ceiling on highly-segmented sends has moved from 10-20% with manual segmentation to 20-40% with AI segmentation plus generated copy, but only when the underlying data is clean. OperatorAI (GoGoChimp's CRO methodology, distinct from OpenAI's Operator agent product) sits squarely in this band.
Apple Mail Privacy Protection. Open rates are now structurally inflated for any list with iOS users. The ratio CTR/open lost meaning around 2021. Use unique CTR (unique clicks divided by delivered) as your primary metric instead.
Mobile dominance. In 2012, 27% of emails were opened on mobile. In 2026 it's 65-75% for B2C and 40-55% for B2B. Subject lines truncate at 35 chars. Single-column responsive templates are non-negotiable.
The base economics haven't changed: relevance times timing times clear next action equals CTR. The tools for executing all three have improved by orders of magnitude. The teams that win are still the ones that obsess over the same fundamentals.
Build Grow Scale's 2026 review across 347 e-commerce stores ([Stafford, 2026](https://buildgrowscale.com/cro-trends-2026-recap)) found expert-guided AI CRO delivers 28-34% average conversion lift, compared to 4-7% from self-serve AI tools. The same dynamic plays out at the CTR level: the agencies and in-house teams that pair AI segmentation with a 13-year CRO expert sitting on top of the prioritisation calls hit the top of the band. Teams that hand the entire workflow to autopilot land near the floor.
Frequently asked questions
What is a good click-through rate?
It depends on the channel. Email permission-based: 5-15% for B2B newsletters, 2-12% for B2C promotional, 10-20% for highly segmented, 15-50% for trigger-based. Display advertising: 0.2-0.5% is typical. Paid search: 3-6% on branded queries, 1-3% on non-branded. Compare against your last 13-week rolling average rather than absolute industry benchmarks.
How do I calculate click-through rate?
CTR = unique clicks divided by tracked opens times 100 (for email) or unique clicks divided by ad impressions times 100 (for display/paid). For email, "unique" means counting one click per individual regardless of how many times they clicked. Worked example: 30 tracked opens, 3 unique clicks = 10% CTR.
Why is my email CTR so low?
Six common causes: (1) poor opt-in/permission quality, (2) deliverability issues blocking inbox reach, (3) weak subject lines that don't drive opens, (4) too few links or all links pointing to the same destination, (5) generic broadcast send to unsegmented list, (6) ratio CTR distortion from Apple Mail Privacy Protection inflating opens. Fix in roughly that order: list quality and deliverability before creative.
Is CTR or conversion rate more important?
Conversion rate matters more than CTR for revenue, because CTR is mid-funnel. But CTR is the leading indicator that tells you whether your message-to-audience match is right before you can measure conversion. Monitor both. Optimise for downstream conversion. Treat CTR as a diagnostic.
How does CTR affect Google Ads cost?
CTR is a major input to Google Ads Quality Score. Higher CTR (relative to your competitors on the same keyword) means higher Quality Score, which means lower CPC and better ad position. The leverage is significant: improving Quality Score from 4 to 8 can reduce CPC by 30-50%. This is why message match between ad and landing page matters: it lifts CTR, which lifts Quality Score, which lowers cost.
What's the difference between CTR and click rate?
In email marketing, click rate sometimes refers to total clicks divided by delivered (holistic), while click-through rate refers to unique clicks divided by delivered (or unique clicks divided by opens, depending on platform). The terms are often used interchangeably. Always check the exact formula the platform reports.
How does zero-click search affect CTR benchmarks in 2026?
According to Authoritytech 2026, more than 60% of US Google searches now end without a click to any website. AI Overviews displace clicks before they happen. CTR benchmarks from 2018-2023 are obsolete: organic CTR by SERP position has collapsed for positions 1-5 when an AI Overview is present, and the clicks that do arrive skew higher-intent because casual answer-seekers were already satisfied by the AI summary.
Does page speed affect CTR?
Page speed doesn't change the click itself. It changes everything after the click. BeeFRIENDLY Skincare's per-visitor value moved from $1.28 to $29.03 (22.7× lift) after a 2.24-second page-speed reduction, with bounce rate dropping from 82.04% to 38.4%. CTR is mid-funnel; page speed is the engagement compound that turns CTR lifts into revenue lifts.
Want this expertise applied to your campaigns?
GoGoChimp runs paid-media and email programmes for £1M-£50M DTC and SaaS clients, using OperatorAI to combine 13 years of CRO expert pattern recognition with AI-led prioritisation. Build Grow Scale's 2026 research across 347 e-commerce stores found expert-guided AI CRO delivers 28-34% average lift; campaign-level CTR lifts of 40-200% are typical when message-match, segmentation, and trigger logic are all addressed. (Want the full agency context? See how a CRO agency engagement actually works.)
Book a free 15-minute AI audit
No pitch, no follow-up sequence. Just the audit.
Where this fits in the OperatorAI methodology
This article sits under The 99 Rule, one of the three named frameworks inside our OperatorAI methodology. GoGoChimp's discipline of calling A/B test winners only at 99% statistical significance instead of the industry-default 95%, dropping false-positive rate from 1-in-20 to 1-in-100.
For where this work sits in our operating-model maturity classification, see The OperatorAI Maturity Model, the five-tier framework from Ad-hoc through expert-led.
Free chapter
Read Chapter 1 of CITED, free.
The playbook for getting your business recommended by ChatGPT and AI search. Read the first chapter, on me.
Read Chapter 1 freeWant us to do this for your site?
Book a free AI audit. 15 minutes. We’ll show you three things your site is missing and what we’d test first.
Book my free AI audit →