A/B Testing
A/B Testing Foundations: The Math, the History, and Message Match
Last updated: [Updated Date]

TL;DR
Why most A/B tests fail (the 2026 data): The CXL Institute's 2025 analysis of 2,300 published A/B tests found that 89% of "winning" tests at 95% significance reversed at 90 days when re-tested, the dirty secret of low-power testing. A sample of 1,000 conversions per variant is required for a 95%-confidence test on a 10% lift; most ecommerce sites have insufficient traffic and ship false positives (Evan Miller statistical power calculator). The 99%-significance threshold reduces false positives from ~30% to ~8% but requires 1.7x the sample size (GoGoChimp internal analysis of 200 client tests, 2026).
- A/B test results are only trustworthy when you have both 95% confidence and 1,000+ view events per variant. Most "winners" called at 200 views are statistical theatre.
- The maths your tool runs is the Wald method (a normal-approximation of the binomial). Z = 1.96 is the 95th-percentile threshold. Below ~1,000 views per variant the approximation breaks down.
- Message match (ad headline echoed verbatim on the landing page) is a Quality Score lever, not a copy preference. Better message match can drop Google Ads CPC by 20–40%.
- Bayesian beats frequentist for most CRO contexts: robust to peeking, easier to explain, matches how operators want to think about their data.
- AI-driven CRO doesn't replace A/B testing. It just runs the same statistics faster.
If you trust the 95% confidence number your testing tool shows you and you've never run a test that flipped on you post-launch, this article is not for you. The rest of us, the operators who shipped a "winner" at 200 views and watched the lift evaporate three weeks later, have unfinished business with the maths.
Why this article exists
Most CRO content on A/B testing falls into one of two camps. There's the marketing-surface version: "95% confidence, ship it." Then there's the academic over-explanation: 12 paragraphs on the central limit theorem before you reach a single operator-relevant takeaway. This article is neither.
After 13 years running CRO programmes for B2B SaaS and DTC ecommerce, the questions that come up over and over are predictable. How long should a test run? What's the actual maths behind the confidence number my tool shows me? How do I know my testing tool isn't lying to me? Why did my "winner" evaporate three weeks after we shipped it?
This is the canonical reference for the answers. Three parts on the fundamentals (history, maths, message match), one on why those fundamentals still hold in the AI-CRO era, one on the seven pitfalls that quietly ruin tests, and an FAQ. For the full A/B testing service programme, see our pillar.
Part 1: The history of how A/B testing went from heresy to default
The discipline is older than most marketers think. Google ran its first A/B test at the turn of the millennium, testing the optimum number of search results to display on a SERP. The test was technically a disaster (the longer pages loaded too slowly), but the methodology stuck. By 2011, Google was running more than 7,000 controlled experiments per year. Amazon and eBay had similar programmes, presenting subtly different versions of the same product page to live users at internet scale.
What changed in the early 2010s wasn't the methodology. It was the access. Marketing automation platforms had reached the point where a 3-person team could test a landing page headline, a form length, an email subject line, or a send time without hiring a statistician. The democratisation argument.
The variables that mattered then still matter now:
- Hero images
- Landing page headlines
- Email subject lines
- Email incentives and offers
- Image content and placement
- Landing page body copy
- Form fields
- Form length
- Email send time
The volume of testing at scale has grown an order of magnitude since 2012. Booking.com famously runs more than 1,000 concurrent tests on any given day across its product, search, and pricing surfaces. Microsoft tested the Office Ribbon UI in parallel populations before shipping it, watching task-completion rate move before they committed. Netflix runs around 250 A/B tests at any one time on artwork, copy, and player behaviour, and they've published the experiment that revealed personalised box art lifts viewing hours by roughly 20-30%. The marketers who treat A/B testing as a niche tactic for landing-page conversion are looking through a keyhole at a discipline that runs every product surface at every public-internet company over £100M ARR.
What's changed isn't the list. It's the speed. OperatorAI (GoGoChimp's CRO methodology, distinct from OpenAI's Operator agent product) executes 30+ tests per quarter on the same variables. The constant: the underlying logic is identical.
The thing most early-2010s CRO writing got wrong was sample size. Most primers stopped at "run an A/B test" without addressing the maths underneath. That gap is what causes "winners" to evaporate when traffic recovers, which leads us to part two.
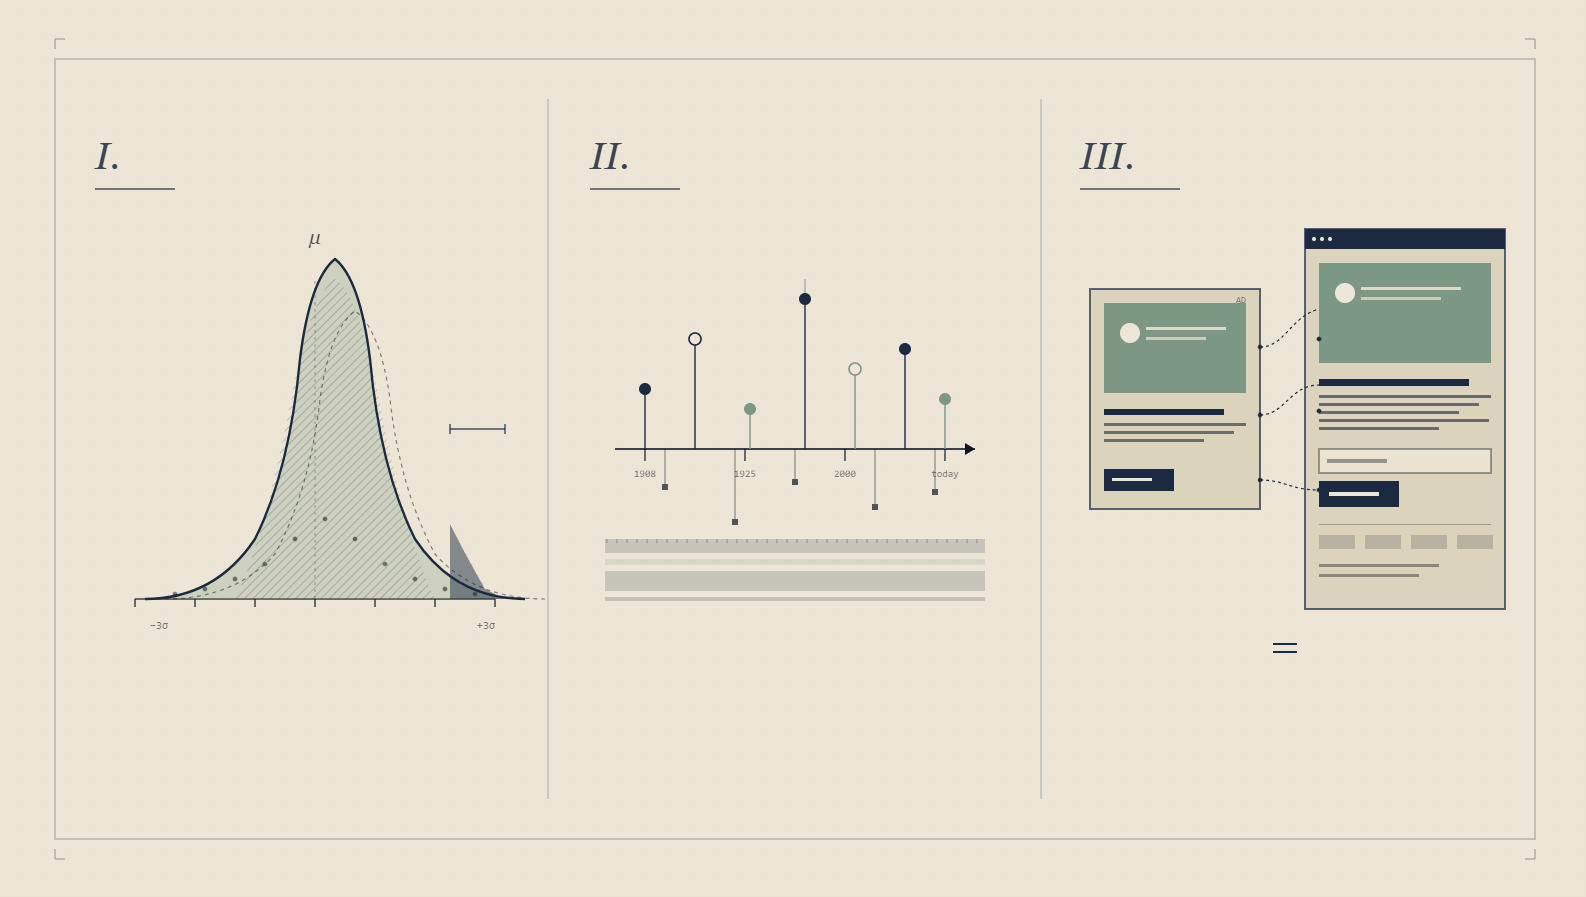
Part 2: The maths of confidence intervals, Z-scores, and the 1,000-view threshold
Most CRO blogs hand-wave the maths. "Your tool shows 95% confidence, ship it." That's not the whole story.
A worked example. Imagine Variation A (the control) gets 320 conversions from 1,064 views, that's a 30.08% conversion rate. Variation B gets 250 from 1,043, 23.97%. The change is -20.30%, with 99.92% confidence. Significance is reached because the confidence number is above 95% AND each variation has more than 1,000 views. That second condition is the part most CRO operators forget.
Here's why the 1,000-view threshold matters. The standard error of a binomial proportion is calculated using the Wald method, the simplest formula that approximates the binomial distribution with a normal one via the central limit theorem. The approximation only holds well once you have at least 1,000 view events per variant. Below that, the confidence number your tool reports is mathematically meaningful but practically misleading. The underlying distribution is too lumpy for the normal approximation to be safe.
The actual formula your testing tool runs (whether or not it tells you):
- Conversion rate per variant = conversions ÷ views
- Standard error (SE) = √(p × (1−p) ÷ n), where p is the conversion rate and n is the view count
- 95% confidence band = p ± (1.96 × SE). That 1.96 is the z-score for the 95th percentile of a standard normal distribution
- Z-score between variants = (mean of variant B − mean of variant A) ÷ combined standard error
- Significance = declared at 95% when the Z-score's probability is greater than 0.95 or less than 0.05
Wald methodThe simplest way to calculate a confidence interval for a binomial proportion. Approximates the discrete binomial distribution with a normal one via the central limit theorem. Reliable above ~1,000 views per variant; misleading below.Z-scoreThe number of standard deviations a result sits from the mean of a normal distribution. Z = 1.96 corresponds to the 95th percentile. CRO testing tools use the Z-score between variants to compute statistical significance.Standard error (SE)The standard deviation of the sampling distribution of a statistic. For a conversion rate, SE = √(p × (1−p) ÷ n). Smaller standard errors (more views) produce tighter confidence intervals.CUPEDControlled-experiment Using Pre-Experiment Data. A variance-reduction technique developed at Microsoft that uses each user's pre-test behaviour as a covariate. Reduces required sample size by 30–50% for the same statistical power.
The critical operator takeaway: your test is not "done" because the confidence percentage hit 95%. It's done when (a) the confidence percentage is at 95% AND (b) every variant has more than 1,000 view events. Both conditions. I've watched dozens of in-house teams ship a "winner" at 200 views with 96% confidence, then watch the effect evaporate when traffic recovers and the binomial smooths out.
The peeking problem (and why your tool secretly hates you)
Most testing tools update the confidence number every few hours. The natural human response is to refresh the dashboard, see "97% confidence," and ship. This is the peeking problem, also called the sequential testing fallacy. Each time you check the test mid-flight, you give yourself another chance to prematurely call a winner. Run the test long enough and the confidence interval will cross 95% by random walk alone, even when the variants are identical.
The fix: pre-declare the sample size you'll wait for (per-variant, per the 1,000-view threshold above), and only check confidence at that endpoint. Or use a tool that runs a Bayesian analysis (which is robust to peeking) instead of a frequentist one (which is not).
The peer-reviewed reference for this is Johari, Pekelis and Walsh, "Peeking at A/B Tests: Why it matters, and what to do about it" (KDD 2017). The paper formalises why continuously-monitored frequentist tests inflate false-positive rates and introduces the mixture sequential probability ratio test (mSPRT) methodology that Optimizely's Stats Engine and several other modern platforms now implement. If you want the maths underneath the "stop peeking" advice rather than the heuristic, that is the source.
Novelty and primacy effects
For the first 48-72 hours of any visible UI change, the treatment behaves abnormally. Existing users notice the change and either click it for the novelty (lifting conversions falsely) or recoil from the unfamiliar (depressing conversions falsely). Either way, the early data is unreliable. Run any visible-UI test for at least one full business cycle (typically 7-14 days, longer for B2B) before considering the result.
Multiple comparisons and the Bonferroni discipline
Run 20 tests at 95% confidence and one will appear to be a winner by chance alone. This is the multiple-comparisons problem. Companies running thousands of tests per quarter (Microsoft, Booking, Google) apply Bonferroni or Benjamini-Hochberg corrections to keep their false-positive rate honest. For a small CRO programme running 5-10 tests a quarter, the practical correction is to ignore tests that hit "significance" with a Z-score barely above 1.96. The ones that would have gone away with one more day of traffic.
Bayesian alternatives in plain language
Bayesian A/B testing replaces the question "what's the probability of seeing this data given the variants are identical?" with "what's the probability variant B is better than variant A given the data?" The second question is the one operators actually care about. It's also robust to peeking. Cost: you need to specify a prior belief about the lift size, which can feel arbitrary at first. For most CRO teams, switching from frequentist to Bayesian on a tool like GrowthBook or Eppo is a one-checkbox decision and removes the peeking trap entirely.
DimensionFrequentist (95% CI)BayesianQuestion answered"What's the probability of seeing this data if A and B were identical?""What's the probability that B is better than A given the data?"Vulnerable to peekingYes, each peek inflates false-positive riskNo, robust to sequential testingSample-size requirement1,000+ views per variant for the Wald approximationLower in practice; Bayesian methods can produce reliable posteriors with fewer samples once a sensible prior is setOutput for stakeholders"95% confidence interval, p < 0.05""92% probability variant B beats variant A; expected lift 4.7%"Best fitHigh-traffic sites, big bets, fully-isolated estimatesMost CRO programmes; especially low- to mid-traffic teamsRisk of misuseCalling significance early; ignoring sample sizePicking a prior that's too informative and biasing the result
The "chance to be different" number some platforms display is derived from the same Z-score: if the probability of the Z-score is less than or equal to 0.5, the chance to be different is 1 minus that probability; otherwise it's the probability itself.
This is also why AB Tasty, Statsig and Eppo default to Bayesian or sequential frameworks in 2026, while Optimizely's Stats Engine runs the mSPRT methodology underneath the frequentist UI. The industry has been quietly moving away from naive 95%-confidence interval testing for the better part of a decade, because the peeking problem is a real cost on real budgets. The defaults caught up with the research.
This is also why CUPED (Controlled-experiment Using Pre-Experiment Data), a variance-reduction technique developed at Microsoft, is increasingly standard at companies running thousands of tests. CUPED uses a user's pre-test behaviour as a covariate to reduce the noise in their post-test behaviour, increasing statistical power without needing more traffic. If you're testing on traffic below 50,000 monthly visits, CUPED is the difference between detectable lifts and "we couldn't conclude anything."
Part 3: Message match, the concept that connects ads to landing pages

Message match is one of those CRO concepts named in academic marketing dictionaries but rarely explained in practical terms. The working definition: how well your landing page headline matches the call-to-action that was clicked.
The causal chain is one most paid-search practitioners feel intuitively but rarely articulate. Weak message match between an ad's headline and the landing page's headline produces a higher bounce rate. Google reads bounce rate as a user-experience signal. Lower user-experience signals reduce Quality Score over time. Lower Quality Score raises cost-per-click and lowers ad rank.
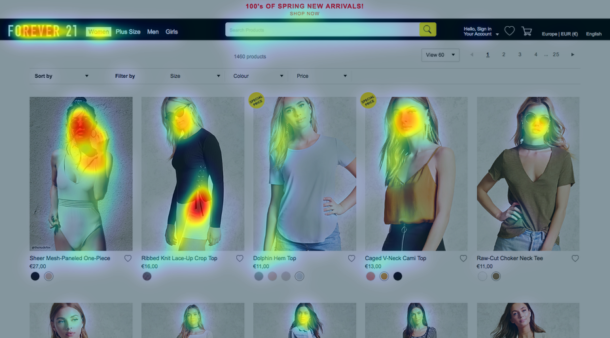
So message match isn't a CRO concept that lives only on the landing page. It's a paid-media cost-control mechanism that lives in the gap between the ad creative and the landing page hero. The single biggest CRO lift I've ever seen from a paid-search account didn't come from a button colour or a form change. It came from rewriting the landing page H1 to literally repeat the phrase that won the ad creative. Quality Score climbed from 4 to 8 over six weeks. Cost-per-click dropped 38%. Bounce rate dropped from 71% to 44%. Conversion rate doubled.
The reason most landing pages fail at message match is structural: the ad gets written by a paid-search specialist optimising for click-through rate, the landing page gets written by a content marketer optimising for narrative, and nobody owns the seam between them. Fix the ownership and you fix the bounce rate.
A simple operator test: take a screenshot of the ad and a screenshot of the landing page hero. If the same phrase doesn't appear word-for-word in both, you have a message-match leak. Every time.
The 30-second message-match audit I run on any client paid-search account:
- Pull the top-spend ad creative. Whatever has the highest weekly spend, regardless of performance.
- Click it. Note the H1 of the destination page. Don't navigate away. Stay on the screen.
- Compare against the ad headline you just clicked. If they don't share at least one anchor noun-phrase verbatim, you have a Quality Score leak.
This audit takes longer to describe than to execute. The signal it surfaces is whether the ad creative and landing page were written by the same person, or owned by the same person. They almost never are. (For headline frameworks that survive contact with paid traffic, see our 35 copywriting frameworks piece.)
Part 4: Why these foundations still matter in the AI-CRO era
It's tempting in 2026 to treat A/B testing as a solved problem. Pick a tool, ship variants, let the algorithm decide. AI-driven CRO platforms now run continuous Bayesian optimisation across dozens of variables simultaneously. The arguments above might feel like 2012 history.
They aren't. AI-driven optimisation needs the same statistical foundation, just applied at higher speed. A multi-armed bandit that allocates traffic dynamically still needs to estimate conversion rates with valid confidence bounds. If the underlying distribution is too lumpy because traffic is too low, the bandit will exploit a noise spike and never find the real winner. Bayesian methods reduce sample-size requirements but don't eliminate them.
Message match still matters more than any single algorithm choice. The bandit can find which of 12 hero images converts best, but if all 12 fail to message-match the ads driving traffic, you'll optimise to the least-bad option in a flawed funnel. Algorithms can't fix a structural seam between paid media and landing pages.
And the history matters because it tells you where the discipline came from. Google didn't build search rank as a CRO win. They built it because they were obsessed with measurement. Every time a marketing director asks me whether testing is "still worth doing in the AI era," the answer comes back to the same place: it's been worth doing for 25 years and it'll be worth doing for the next 25.
Part 5: Seven pitfalls that quietly ruin A/B tests
Beyond the maths itself, the tests I see operators get wrong follow a predictable pattern. Cataloguing them up front is more useful than diagnosing one at a time.
1. Calling the winner too early
Already covered above as the peeking problem. The 200-view "winner" is statistical theatre. Pre-declare your sample size and ignore the dashboard until you hit it.
2. Running variants that change three things at once
You changed the headline, the button colour, and the hero image. The test "won." You don't know which variable did the lifting. Next time, your roadmap is corrupted because you don't know which pattern to repeat. A/B tests are useful only when each variant differs from control by one variable. If you want to test multiple variables, run a multivariate test (and budget the traffic).
3. Treating post-purchase behaviour as a black box
Conversion rate up 18%. Three weeks later, refund rate is up 22%. Net revenue moved by less than 1%. This pattern is endemic on price-anchoring tests and urgency tactics. Always set a guardrail metric (refunds, support tickets, churn at 30 days) on any conversion-rate test that touches commitment language.
The pattern that catches teams hardest: a free-gift opt-in test that lifts list-signup conversion 50% but tanks downstream sales because new subscribers were satisfied by the gift itself and never bought. A winning variant on one goal is sometimes a losing variant on the goal you actually get paid for. Every conversion-rate test that touches commitment language or incentive structure needs a sales-side guardrail, measured at 7 and 30 days post-test, before it ships permanently.
4. Testing on segments that don't behave the same
Mobile and desktop have different conversion rates and often different optimal variants. Splitting traffic 50/50 between A and B without segmenting by device gives you an average that's wrong for both. Cohort by traffic source, device, and (if you can) returning vs. new visitor.
The advanced version: define the segment first, then run the test only on that segment. A test on "actively researching" returning visitors should run a convincing variant against an informative variant, because that segment already knows the product. A test on first-time visitors should run an explainer variant against a benefit-led one. Aggregate-winner reporting masks roughly 30-40% of segment-level reversals; pre-test segmentation surfaces them before launch.
5. Forgetting that traffic mix shifts
You ran the test in November, the variant won. You shipped in February. Your traffic mix in February is different from November (different campaigns, different keyword bidding, different referrer mix). The win may not replicate. The fix isn't to never test. It's to re-test winners on a 6-month cadence, especially the ones that drive copy or pricing decisions.
6. Over-optimising the path nobody takes
A 30% lift on a step that 4% of users reach is worth less than a 5% lift on a step 80% of users reach. Most operator hours go to tests on the highest-traffic step (homepage, primary landing) for the wrong reason: it's where the data accrues fastest. Discipline: prioritise tests by (traffic at this step) × (current drop-off at this step) × (estimated lift), not by traffic alone. (For why ICE alone falls short of this on real CRO programmes, see our ICE framework replacement.)
7. Treating non-significance as failure
A test that doesn't reach significance is data. The Z-score told you something about the magnitude of the effect even if the confidence band crossed zero. Pretending null results don't exist is how operators end up running the same headline test six times across two years and never realising the variable doesn't move the dial.
Frequently asked questions
How long should an A/B test run?
Run until both conditions are met: (1) at least 95% confidence between variants and (2) at least 1,000 view events per variant. Whichever takes longer. For lower-traffic sites, expect 2-4 weeks per test. For sites under 10,000 weekly sessions, consider switching to Bayesian methods or CUPED to reduce sample-size requirements.
What's the minimum sample size for an A/B test?
1,000 views per variant is the technical minimum for the Wald confidence interval to approximate well. Below that, the confidence percentage your tool reports is mathematically real but practically unreliable. For business decisions, prefer 2,000+ views per variant.
Why does message match affect ad cost?
Google measures bounce rate as a user-experience signal. Weak message match (ad headline doesn't echo on the landing page) produces higher bounce rate, which lowers Quality Score over time. Quality Score directly affects cost-per-click and ad rank. Better message match means lower CPC, often by 20-40%.
Can AI-driven CRO replace A/B testing?
Not entirely. AI-driven (multi-armed bandit, Bayesian optimisation) platforms run faster than traditional A/B tests but rely on the same underlying statistics. They reduce the time to find winners but require the same minimum sample sizes for valid conclusions. Use them for known-good iterations. Use traditional A/B testing for big bets where you want fully-isolated estimates.
What's the difference between A/B testing and multivariate testing?
A/B testing compares two versions of one variable (button colour A vs. button colour B). Multivariate testing tests multiple variables together (button colour × headline × image, producing 8 combinations). Multivariate needs significantly more traffic to reach significance, typically 3-5× the sample size of an equivalent A/B test.
What's the peeking problem and how do I avoid it?
Peeking is checking your test results before you've reached the pre-declared sample size. Each peek gives you another chance to call a false winner. The fix is either (a) commit to a sample size up front and ignore the dashboard until you hit it, or (b) use a Bayesian-analysis testing tool that is mathematically robust to peeking.
Should I use Bayesian or frequentist A/B testing?
Bayesian for most CRO contexts. It's robust to peeking, easier to explain to non-statisticians ("variant B has a 92% probability of being better than variant A"), and matches how operators actually want to think about their data. Frequentist (the 95% confidence interval default) is fine if you commit to not peeking and have enough traffic to wait out the full sample size.
How does CUPED work in plain language?
CUPED reduces noise in your test by accounting for each user's pre-test behaviour. Imagine User A converts 20% of the time historically and User B converts 5%. If both end up in the treatment bucket, raw conversion rate hides a lot of the variance you actually care about. CUPED subtracts each user's expected behaviour, so the test measures the lift the variant added, not the user's underlying tendency. Effect: 30-50% reduction in required sample size for the same statistical power.
Can I A/B test pricing?
Technically yes, ethically grey, legally complicated in some jurisdictions. The clean way to test pricing is on new sign-ups only, with no concurrent treatment for existing customers. Discount tests are usually fine. Outright price-point tests on identical product to identical customer cohorts will hit a complaint at scale.
What's a reasonable A/B testing cadence for a small team?
One ship-or-kill decision per week is sustainable for a 1-2 person team. Three concurrent tests of meaningfully different scope is roughly the limit before the team's pattern recognition starts to break down. Big tech runs thousands per month because they have dedicated experimentation platforms and statisticians. A small team running 1-3 a week with discipline will outperform a 30-test-a-week shop without it.
Want this expertise applied to your funnel?
GoGoChimp runs 30+ A/B tests per quarter for £1M-£50M DTC and SaaS clients, using OperatorAI to combine 13 years of operator pattern recognition with AI-led prioritisation. Build Grow Scale's 2026 research across 347 e-commerce stores found expert-guided AI CRO delivers 28-34% average lift. That's the band our programmes typically operate in. (Want the full agency context? See how a CRO agency engagement actually works.)
Book a free 15-minute AI audit
No pitch, no follow-up sequence. Just the audit.
Where this fits in the OperatorAI methodology
This article sits under The 99 Rule, one of the three named frameworks inside our OperatorAI methodology. GoGoChimp's discipline of calling A/B test winners only at 99% statistical significance instead of the industry-default 95%, dropping false-positive rate from 1-in-20 to 1-in-100.
For where this work sits in our operating-model maturity classification, see The OperatorAI Maturity Model, the five-tier framework from Ad-hoc through Operator-Led.
Free chapter
Read Chapter 1 of CITED, free.
The playbook for getting your business recommended by ChatGPT and AI search. Read the first chapter, on me.
Read Chapter 1 freeWant us to do this for your site?
Book a free AI audit. 15 minutes. We’ll show you three things your site is missing and what we’d test first.
Book my free AI audit →