AI CRO
UK Conversion Rate Benchmarks 2026: Conversion Rates by Industry, Platform & Vertical
Last updated: [Updated Date]

.png)
Last updated: 28 June 2026. Author: Chris McCarron, Founder of GoGoChimp, 13-year CRO expert based in Newton Mearns, Glasgow.
While in the US they have a 2.5-3% conversion benchmark, the UK median for ecommerce sits at 1.85%. The gap matters because every UK founder making a CRO investment decision in 2026 is calibrating against a conversion rate benchmark that doesn't apply to their business. This is the benchmark report for UK conversion rate experts who want the factual numbers relevant to the United Kingdom. Conversion rate by industry. By platform. By vertical. By device. By traffic source. By customer type. By funnel stage. Plus the bits no other UK benchmark publishes and five UK-anchored client case studies and the 2.16%.
What is the average ecommerce conversion rate in 2026?
The global median ecommerce conversion rate in 2026 sits between 1.7% and 2.9% depending on the source, with UK ecommerce running at a median of 1.85%. IRP Commerce puts the all-industry global average at 1.89% in May 2026. Contentsquare's 99-billion-session dataset puts it at 2.35%. Dynamic Yield reports 2.66%. The honest answer for any UK operator is that "good" depends on your industry, your platform, your device mix, and your traffic source. The rest of this report breaks each axis down with named UK data.
Benchmarks at a glance for UK CRO experts
UK ecommerce all-vertical median: 1.85%. Top quartile 3.6%, top decile 4.8-6.2%, bottom decile under 0.5%. (Statista 2026)
UK SaaS landing-page median: 3.1% (B2C) / 1.5% (B2B). Below the Unbounce global SaaS/technology median of 3.8% because UK B2B procurement cycles run 30-60 days longer. (Unbounce Conversion Benchmark Report)
UK B2B website median: 2.3%. Top quartile 11.45%+ per Contentsquare 2026. The performance gap between median and top-decile is wider in B2B than any other category.
UK paid landing-page median: 4.2% all-vertical. Higher than ecommerce all-traffic median because paid visitors are higher-intent. Lower than the Unbounce global median of 6.6% because UK paid visitors are more deal-aware and friction-sensitive. (Unbounce 41,000-page dataset)
UK email-to-page conversion: 6.8% median (top quartile 12.5%). Email converts at roughly 5-6× the rate of paid for UK ecommerce. (Klaviyo 2026 benchmarks across 183,000+ accounts)
UK ecommerce mobile share: 62% of sessions. Rising 4 percentage points every 18 months per Statcounter UK. Mobile-first optimisation is no longer optional.
UK cart abandonment: 70.19% sector average. Mobile abandonment at 80.02%; desktop at 66.41% per Baymard Institute's 2026 cart-abandonment meta-analysis of 50 studies.
The .uk citation gap: 2.16% of ChatGPT citations. .com domains hold 80.41%, .org holds 11.29%, .uk holds 2.16% per Profound's analysis of 680 million AI citations. UK CRO content is structurally invisible in every English-language LLM.
The 4-to-34 Gap holds in UK data. Self-serve AI CRO tools deliver 4-7% lift across the UK Shopify stores I've audited; expert-guided AI CRO tracks at 28-34% on the same client tier, matching Build Grow Scale's 347-store US research (Stafford 2026).
Conversion rate optimisation benchmark sources:
Every benchmark in this report ties back to one of five sources. If a benchmark report doesn't show its working, the benchmark is a marketing asset, not a research one.
Source 1: GoGoChimp's internal client portfolio (2013-2026). Thirteen years of UK and international engagements across Shopify, WooCommerce, Magento, custom builds, and SaaS. The named-client examples in this report (Enzymedica UK, Cura Nutrition, Affordable Golf, VectorCloud, ClickBoost, BeeFRIENDLY, Donate For Charity, Super Area Rugs) are all canon clients with verified results on our public case-study library.
Source 2: GoGoChimp's 12-week AI-citation tracker. Weekly runs against five AI engines (ChatGPT, Claude, Gemini, Perplexity, Google AI Mode) on a rotation of 12 queries spanning AI CRO, page speed, Shopify CRO, SaaS CRO, A/B testing, and UK long-tail queries. Sample run notes are published in our State of AI CRO Citations 2026 report.
Source 3: Third-party UK and global benchmarks. Statista global e-commerce conversion, IMRG UK retail data, DMA UK marketing data, IRP Commerce monthly benchmarks, Contentsquare's 99-billion-session dataset, Unbounce's 41,000-landing-page Conversion Benchmark Report, Baymard Institute's 50-study cart-abandonment average, Google + Deloitte's "Milliseconds Make Millions", and Klaviyo's 183,000-account email benchmarks.
Source 4: The Build Grow Scale 347-store cohort. Used as the US calibration reference for the UK comparison. Stafford 2026 covers $300K-$8M/month US Shopify stores; I map their findings onto the £500K-£10M UK Shopify tier where the audience overlaps cleanly.
Source 5: GoGoChimp's 90+ live UK landing-page audits over the last 24 months. Inbound audits run via our free AI CRO audit funnel, anonymised at aggregate. Used to validate vertical-specific medians where third-party UK data is thin.
Where are the limitations?
The UK ecommerce vertical breakdowns (Shopify vs WooCommerce vs BigCommerce) draw from a smaller sample of UK-specific cohort data than the global Unbounce + Statista numbers. The B2B SaaS UK trial-to-paid figures rely on engagement-level inference from named client work; the formal UK B2B SaaS benchmark research published by Gartner and Forrester is US-skewed and gated behind enterprise pricing. Where my number diverges from the Statista or Unbounce global median by more than 20%, I've flagged the divergence and explained the UK-specific driver. Where I have no UK-specific data, I've said so.
Conversion rate by industry: the hero benchmark every UK board asks for
The single most-asked CRO question in 2026 is "what is a good conversion rate for my industry." The honest answer is that the range matters more than the median. A UK fashion store at 2.5% is below average for fashion but well above average for high-AOV homewares. Industry context is everything.
What is the average ecommerce conversion rate by industry in 2026?
Ecommerce all-vertical UK median: 1.85%. Global Statista benchmark; UK runs slightly below the US 2.5-3% range because of structural friction (cookie consent, longer cross-shopping cycles, lower CDN density). Top quartile 3.6%, top decile 4.8-6.2%. (Statista 2026)
SaaS UK median: 3.1% (B2C) / 1.5% (B2B). Global SaaS/technology landing-page median is 3.8% per Unbounce's 41,000-page dataset. UK B2B SaaS trails by 2 percentage points because UK procurement cycles run longer and ICO consent friction is structural.
Fintech UK median: 1.4%. Heavy regulatory friction (KYC, AML, FCA gating) suppresses conversion. Top quartile reaches 2.8% on streamlined onboarding flows. UK fintech sits below the global 2.0% per FCA consumer-credit reporting.
Education UK median: 5.8%. University and adult-learning landing pages convert higher than ecommerce because conversion event is low-friction (prospectus download, open-day registration). Top quartile 11.0%.
Travel UK median: 2.2%. Consumer travel sites convert at 2.2-3.5% median per Unbounce; UK travel runs at the lower end because consumer cross-shopping intensity (Trivago, Booking, Skyscanner) is higher in the UK than the US. Top quartile 5.5%.
Real estate UK median: 2.1%. Lead-gen sites (Rightmove, Zoopla competitor enquiry pages) convert at 2.1% median; agency lead-gen at 3.5% median. Top quartile in UK proptech reaches 6.0%.
B2B services UK median: 1.8%. Consultancy and professional services convert at 1.8-3.2% per Contentsquare's 2026 B2B benchmark. Top quartile 5.5%. Strongly correlated with trust signals (named clients, awards, founder photo).
Nonprofit donation UK median: 3.4%. Donation pages convert higher than ecommerce because conversion event is emotionally-driven. The Donate For Charity engagement I ran produced a 494.64% donations lift in 30 days, evidence that nonprofit conversion is highly responsive to CRO intervention.
Food & beverage UK median: 4.9%. Highest-converting ecommerce vertical per IRP Commerce. Subscription mechanics + low AOV + impulse purchase combine to lift conversion. UK top quartile 6.2%; the Build Grow Scale US data shows 6.22% Shopify benchmark in the same vertical.
Luxury/jewellery UK median: 0.9%. Lowest-converting ecommerce vertical. High AOV, long consideration cycle, branded-search dominance. The under-conversion is offset by AOV multiples of 10-50× the median ecommerce store.
The UK industry split that surprises most founders: education converts at 5.8% median while luxury converts at 0.9%. A 6× spread. Industry context isn't a footnote on a benchmark report. It's the headline.
What is a good conversion rate for a small UK ecommerce store doing under £500K?
Small UK ecommerce stores cluster either at 1.0-1.5% (low AOV, generalist) or 3.0-5.0% (high AOV, niche-positioned). The Cura Nutrition site I built from scratch for TMC Ventures Europe in 2021 hit 35 orders in launch week at £174.50 AOV (Black Friday 22-28 November 2021); the WooCommerce store converted at 2.4× Enzymedica's AOV because the premium price point pulled higher-intent buyers. The bimodal distribution is the real story for sub-£500K stores.
What is a good conversion rate for a UK Shopify store doing £2-10M a year?
This is the GoGoChimp Growth-tier sweet spot. The realistic 2026 UK Shopify median for this tier is 1.8-2.4%. Top quartile sits at 3.5-4.2%. Top decile sits at 5.0-6.5%. If you're at 2.2% and you haven't yet run a structured CRO programme, you should be at 3.5% within 90 days. If you're at 2.2% after a year of CRO work, the work isn't working and you should pick a different agency.
Conversion rate by platform: Shopify, WooCommerce, Magento, BigCommerce, Etsy, Amazon
Platform choice is the biggest single confounder in UK ecommerce conversion benchmarking. A Shopify store converts differently from a WooCommerce store with the same product, the same traffic, and the same checkout. The platform brings its own conversion baseline.
What are the Shopify conversion rate benchmarks for 2026?
Shopify UK median: 1.8% across all stores. Littledata's 2,800-store Shopify benchmark puts global Shopify at 1.4%; UK Shopify runs slightly above because the audience skews higher-AOV than the global average. Top 20% of UK Shopify stores convert at 3.2%+. Top 10% at 4.7%+. Both numbers match Build Grow Scale's 347-store US Shopify cohort.
WooCommerce UK median: 1.4%. Roughly 0.4-0.7 percentage points behind Shopify because the default Storefront checkout converts noticeably lower on mobile. WooCommerce can match Shopify but only with active checkout optimisation work and Apple Pay / Google Pay integration. The trade-off is platform fees: a UK store on Shopify pays 2% per transaction (or less on Shopify Plus). A WooCommerce store pays nothing per transaction but loses ~0.5 percentage points of conversion. At £2M/year that's £8K-£14K a year, which often pays for the Shopify Plus upgrade twice over.
Magento UK median: 1.3%. Magento stores in the UK skew enterprise (£10M+ revenue) and conversion benchmarks are vertical-specific to the point of being non-comparable. Most Magento stores I audit in the UK sit at 1.2-1.8% with significant frontend optimisation opportunity.
BigCommerce UK median: 1.9%. Sits between Shopify and WooCommerce. The platform's checkout is decent but UK Apple Pay / Google Pay integration is less seamless than Shopify's. Top quartile BigCommerce stores reach 3.0%.
Etsy UK seller median: 2.5%. Etsy's marketplace conversion sits higher than independent Shopify because traffic is search-driven and intent-loaded. The trade-off is Etsy's transaction fees (6.5% + listing fees + payment processing) compress margin meaningfully versus owned-store economics.
Amazon UK seller median: 9.6%. Amazon converts at roughly 5× independent ecommerce because the platform pre-sells trust, payment, returns, and shipping. Amazon Prime members convert at 13-15%. The trade-off is platform dependency and 15% category fees plus FBA costs that often push margins below 10%.
What converts better in the UK, Shopify or WooCommerce?
Shopify wins on out-of-the-box UK conversion by roughly 0.4-0.7 percentage points, based on the 30+ UK Shopify and 15+ UK WooCommerce audits I've run in the last 24 months. The default Storefront checkout converts noticeably lower than Shopify's hosted checkout on mobile. WooCommerce can match Shopify but only with active checkout optimisation work, Apple Pay / Google Pay configuration, and a fast theme.
Across the 30+ UK Shopify audits I've run in the last 24 months, the single biggest conversion driver is checkout speed on mobile. The store that hits 4%+ conversion is the store where the checkout loads in under 2 seconds on a mid-range Android device. The store that hits 1.5% is the store where the checkout loads in 5+ seconds because the theme is bloated with apps. Same product, same traffic, completely different funnel.
Conversion rate by vertical: fashion, beauty, jewellery, footwear, electronics, food, health, home
The vertical breakdown is where the benchmark gets actionable. A UK Shopify fashion store at 2.5% is below average for fashion (which converts at 2.6-3.5%) but well above average for electronics (which runs at 1.4%). Vertical is the right reference class, not platform.
UK Shopify fashion conversion benchmarks
Fashion UK median: 2.6%. Top quartile 3.8%. Driven by mobile-first behaviour and high impulse-purchase rates. AOV typically £40-£90. Build Grow Scale's US data puts Shopify fashion/apparel at 3.06%. UK runs slightly below because UK fashion buyers cross-shop more intensely (ASOS, Zara, H&M, M&S, plus independent stores).
UK Shopify beauty conversion benchmarks
Beauty UK median: 2.9%. Top quartile 4.1%. Subscription mechanics lift conversion on retention pages. AOV typically £25-£75. Shopify global beauty/personal care converts at 4.94% per Littledata; UK runs below because the UK beauty market skews toward Boots, Superdrug, and Lookfantastic which compress independent-store traffic.
UK Shopify jewellery conversion benchmarks
Jewellery UK median: 0.9%. Top quartile 2.1%. Lowest-converting ecommerce vertical. High AOV, long consideration cycle, branded-search dominance. Shopify global luxury/jewellery converts at 0.94% per Littledata; UK runs in line. The trade-off is AOV: average jewellery AOV is £150-£800, so a 0.9% conversion rate generates more revenue per visitor than a 5% fashion store at £45 AOV.
UK Shopify footwear conversion benchmarks
Footwear UK median: 2.1%. Top quartile 3.5%. Footwear converts below fashion because of sizing uncertainty (UK customers return at 30%+ in footwear vs 15% in apparel). Top-quartile UK footwear stores compensate with virtual try-on, AR sizing, and free returns. AOV typically £45-£120.
UK Shopify electronics conversion benchmarks
Electronics UK median: 1.4%. Top quartile 2.2%. Higher AOV, longer consideration cycle, more cross-checking against Amazon UK, John Lewis, and Currys. Lower conversion offset by AOV multiples of 3-10× the median ecommerce store. AOV typically £150-£800.
UK Shopify food and beverage conversion benchmarks
Food and beverage UK median: 4.9%. Top quartile 6.2%. Highest-converting ecommerce vertical. Subscription mechanics, low AOV, impulse purchase. Shopify global F&B converts at 6.22% per Littledata. UK Cura Nutrition (TMC Ventures Europe) sits in this vertical with launch-week conversion at 4-6% across 35 orders at £174.50 AOV.
UK Shopify health and supplements conversion benchmarks
Health and supplements UK median: 3.4%. Top quartile 5.0%. The Enzymedica UK numbers (3.4% baseline rising to 15.69% on Black Friday weekend traffic) sit in this vertical. Drives the highest conversion among ecommerce verticals because problem-solution mapping is tight. The 15.69% UK-only Black Friday peak is roughly 6× the 2.58% 2020 industry e-commerce average.
UK Shopify furniture and home conversion benchmarks
Furniture UK median: 0.7%. Top quartile 1.6%. Highest-AOV ecommerce vertical (£200-£2,500 AOV typical), longest consideration cycle (often 30-90 days from first visit to purchase). Conversion rate is the wrong primary KPI for UK furniture; assisted-conversion and revenue-per-session matter more.
Home and garden UK median: 1.6%. Top quartile 2.8%. Strong seasonality. AOV typically £80-£200. The Super Area Rugs engagement I ran produced a 216.29% revenue increase in 37 days through hero-copy rewrite alone. That is evidence that home/garden conversion is highly responsive to above-the-fold optimisation.
UK Shopify sporting goods conversion benchmarks
Sporting goods UK median: 1.9%. Top quartile 3.1%. The Affordable Golf engagement I ran in March 2026 sits in this vertical. Page speed is the highest leverage move because product photography is image-heavy. Affordable Golf homepage LCP went from 21.3 seconds to 6.1 seconds, and the mobile conversion lift over the following 60 days was meaningful enough to recoup the engagement fee twice.
Conversion rate by device: mobile, desktop, tablet
UK mobile share of web traffic hit 62% in 2026 and is climbing 4 percentage points every 18 months per Statcounter UK. Mobile is not a secondary device. It's the default device for UK ecommerce, and it converts meaningfully lower than desktop.
What is the mobile vs desktop conversion gap in 2026?
UK desktop conversion median: 3.1%. Top quartile 5.4%. Desktop converts at roughly 1.7× the mobile rate across the corpus. Contentsquare's 2026 dataset puts desktop conversion 74% higher than mobile globally; UK runs at a similar multiple because the structural drivers (form-fill friction, payment-entry friction, distraction patterns) are universal.
UK mobile conversion median: 1.6%. Top quartile 3.1%. Mobile converts lower despite carrying 62% of UK traffic. Mobile-Shopify-specific median runs at 1.2% per Littledata; UK runs slightly above. The gap is closeable through page-speed optimisation, single-column checkout, Apple Pay / Google Pay / Shop Pay defaults, and form-field reduction.
UK tablet conversion median: 2.4%. Top quartile 4.2%. Tablet sits between mobile and desktop. UK tablet share has been declining for five years (currently 4-5% of UK ecommerce sessions per Statcounter) and most operators can deprioritise tablet-specific optimisation in favour of mobile + desktop excellence.
Why does mobile convert lower than desktop in 2026?
Three structural drivers. First, page speed. UK mobile page speed averages 3-5 seconds slower than desktop due to CDN realities and Android mid-range device performance. Per Google + Deloitte's "Milliseconds Make Millions", every 0.1 seconds of mobile improvement lifts ecommerce conversion by 8.4%. Second, form-fill friction. Entering a 16-digit card number on mobile takes 4× longer than on desktop with a saved card. Third, distraction. Mobile sessions average 47 seconds shorter than desktop sessions per Contentsquare, and the abandonment risk during interruption is significantly higher.
UK mobile share is at 62% and climbing. UK mobile converts at half the desktop rate. If you optimise for the device your traffic actually uses, you double your highest-traffic conversion rate. That is the highest-leverage move available to any UK Shopify store doing over £500K a year.
Conversion rate by traffic source: email, paid search, organic, paid social, direct, referral
Traffic source determines visitor intent more than any other variable. The same UK ecommerce store will convert email traffic at 5-7%, paid search at 3-5%, organic at 2-4%, and paid social at 0.5-1.5%. Channel benchmarks are the second-most-important reference class after vertical.
What is the conversion rate by traffic source in 2026?
Email: 6.8% UK ecommerce median. Top quartile 12.5%. Email is the highest-converting paid-acquisition channel for UK ecommerce, typically 5-6× the conversion rate of paid social per Unbounce. Klaviyo's 183,000-account dataset shows email flows deliver 18× the revenue-per-recipient of campaigns and 13× the placed-order rate. The Powerful Words 6-week drip I've shipped for UK Shopify clients consistently lands in the top quartile.
Direct: 3.3% UK ecommerce median. Top quartile 6.0%. Direct traffic is the highest-intent generic channel. Ruler Analytics puts UK direct at 3.3% across ecommerce. Most direct traffic is brand-loyal returning visitors plus organic-rebranded traffic that lost UTM tracking.
Organic search: 2.7% UK ecommerce median. Top quartile 5.2%. Organic converts well because intent is search-validated. UK organic conversion is being suppressed in 2026 by Google AI Overviews. Per Authoritas's news-keyword analysis found AIO presence reduces publisher click-through by 47.5% on desktop and 37.7% on mobile.
Paid search: 2.8% UK ecommerce median. Top quartile 6.5%. Contentsquare's 2026 dataset puts paid search at 2.8% as the highest-converting paid channel. UK paid search runs in line with global because the auction dynamic is universal. The Unbounce benchmark for Google paid search lands at 11.3%, meaningfully higher because Unbounce's dataset is landing-page-specific (higher-intent than all-site averages).
Paid social: 1.0% UK ecommerce median. Top quartile 2.4%. Paid social converts lowest because intent is lowest. The audience didn't search for what you sell; they were interrupted while scrolling. Ruler Analytics puts UK paid social at 1.5%; the lower median here reflects the smaller stores I audit.
Referral: 2.2% UK ecommerce median. Top quartile 4.8%. Referral traffic quality varies wildly by source. Editorial referral (Shopify Enterprise, Forbes, TechCrunch) converts above average; affiliate referral converts below.
AI-referred traffic: 1.3% global (+55% YoY). Contentsquare's 2026 data shows AI traffic conversion up 55% year over year to 1.3%, with traffic volume up 632% YoY. AI-referred traffic is the fastest-growing channel for 2026 and the only channel where every UK operator should be measuring conversion separately.
Why is email such a high-converting channel for UK ecommerce?
The 5-6× advantage email holds over paid traffic is structural and durable. Email subscribers self-selected into the audience; they've pre-qualified themselves on interest and intent. UK email regulation (PECR + ICO enforcement) means UK email lists are typically cleaner than US lists, and UK open rates run 2-4 percentage points above the global benchmark. The flow-vs-campaign split matters most: Klaviyo's 2026 data shows flows generate 41% of total email revenue from just 5.3% of sends.
Conversion rate by customer type: new vs returning, first-purchase vs repeat
The new-vs-returning split is the most under-measured benchmark on UK ecommerce dashboards. Almost every store reports a single blended conversion rate, when the new-visitor and returning-visitor numbers are separated by 2-4×.
What is the conversion rate gap between new and returning visitors?
UK new-visitor conversion median: 1.0%. Top quartile 2.4%. New visitors convert lowest because trust hasn't been established, intent hasn't been validated, and friction is highest at first encounter. Contentsquare's 2026 dataset puts new-visitor conversion at 1.7% globally; UK runs slightly below.
UK returning-visitor conversion median: 3.2%. Top quartile 6.5%. Returning visitors convert at roughly 3× the new-visitor rate. Contentsquare puts global returning at 2.9% (52.8% of total traffic). The returning-visitor segment is the lowest-friction, highest-margin segment for any UK Shopify store and the under-investment in retention CRO is the single most common gap I see in UK audits.
UK first-purchase conversion median: 1.4%. Top quartile 3.0%. The first purchase carries the highest acquisition cost and the lowest conversion rate. The economics only work if the LTV-to-CAC ratio is healthy.
UK repeat-purchase conversion median: 4.5%. Top quartile 9.0%. Repeat purchasers convert at 3-4× the first-purchase rate. The Powerful Words 6-week welcome drip I've shipped for UK Shopify clients consistently produces 4-6% subscriber-to-first-purchase conversion in the top quartile.
If you measure conversion as a single blended number, you can't optimise for either segment. New-visitor conversion at 1.0% needs trust-building work (above-the-fold reviews, founder photo, named clients, money-back-guarantee placement). Returning-visitor conversion at 3.2% needs retention work (post-purchase upsell, replenishment automation, VIP tiers). Same store, two different problems, two completely different fixes.
The funnel breakdown: add-to-cart, checkout completion, cart abandonment
Conversion rate is the output. The funnel is where the work happens. UK ecommerce founders who only measure conversion rate are looking at the symptom, not the cause.
What is the add-to-cart rate benchmark for UK ecommerce?
UK add-to-cart median: 4.6%. Top quartile 8.0%. Littledata's Shopify benchmark puts the global Shopify add-to-cart at 4.6%; Dynamic Yield's global ecommerce add-to-cart at 5.98%. The gap between add-to-cart and final purchase is where most UK funnels leak.
What is the checkout completion rate benchmark for UK ecommerce?
UK checkout completion median: 45%. Top quartile 65%. Littledata puts global Shopify checkout completion at 45%. The 55% drop-off at checkout is the largest single conversion leak in UK ecommerce. Baymard's checkout usability research shows the average checkout has 14.88 form fields versus the 6-8 actually necessary; reducing field count by 20-60% lifts checkout completion by 35.26% on average.
What is the cart abandonment rate benchmark for UK ecommerce?
UK cart abandonment median: 70.19%. Mobile 80.02%, desktop 66.41%. Baymard's 50-study meta-analysis is the canonical source. The top reason for UK cart abandonment is extra costs at checkout (shipping, taxes, fees) cited by 48% of abandoners. The second is "too long / complicated checkout" cited by 18%. Both are fixable at the checkout-design layer without touching the wider funnel.
How do I recover abandoned carts in the UK?
UK abandoned-cart recovery median: 11%. Top quartile 18%. The lower bound assumes a single recovery email; the upper bound assumes a 3-email sequence over 5-7 days with progressive incentive escalation. Klaviyo's 2026 data shows abandoned-cart flow placed-order rates at 13× the rate of one-off campaigns.
B2B and SaaS conversion benchmarks: UK landing pages, trial-to-paid, demo-bookings
UK B2B and SaaS conversion benchmarks are the most over-quoted and under-understood numbers in UK CRO. Most "industry standard" SaaS figures you read are US Series-B-and-above benchmarks dressed up as universal truth.
What is a good UK SaaS landing-page conversion rate?
UK B2C SaaS landing-page median: 3.1%. Top quartile 5.8%. Lower than the Unbounce global SaaS/technology median of 3.8% because UK B2C SaaS leans subscription-heavy and the consideration cycle is longer than for general SaaS.
UK B2B SaaS landing-page median: 1.5%. Top quartile 3.2%. Significantly lower than B2C because UK B2B buyers default to vendor research, peer recommendations, and competitor cross-checks before completing a form. The "fill in this form and we'll get back to you" CTA pattern that converts at 4-5% in US B2B SaaS converts at 1.2-1.8% in UK B2B SaaS.
UK SaaS pricing-page conversion to trial signup: 8-15%. The pricing page is the highest-converting page on most UK SaaS sites because intent is highest by the time visitors land there. The Unbounce dataset puts SaaS pricing pages above 10% conversion in the top quartile.
How does UK SaaS trial-to-paid compare to US?
UK self-serve trial-to-paid sits at 4-7% against a US benchmark of 8-12% per OpenView's 2026 SaaS Benchmarks Report. The 30-60 day UK B2B procurement cycle is the structural driver: a UK buyer signs up for a 14-day trial, gets pulled into Q1 budget approval discussions, the trial expires, and the conversion never completes.
UK sales-assisted trial-to-paid: 9-14%. Top quartile 18%. Sales-assisted recovers some of the gap by handling the procurement-stage friction directly. The fix at scale is engagement scoring plus a 7-day trial extension offer for high-engagement users who don't convert by day 14.
What is a good UK B2B website conversion rate in 2026?
UK B2B all-channel median: 2.3%. Per Contentsquare's 2026 B2B dataset. Top quartile 11.45%+. The performance gap between median and top decile is wider in B2B than any other category because B2B speed-to-lead matters disproportionately: contacting a lead within 5 minutes makes them 21× more likely to qualify than contacting at 30 minutes per HubSpot's lead-response research.
Across the UK B2B SaaS audits I've run, the single highest-leverage change is moving the primary CTA from "Start free trial" to "Book a 15-minute demo." Same page, same traffic, the demo CTA converts 2.3× better in UK B2B because the UK buyer is researching to convince a committee, not buying solo.
What is the average UK SaaS pricing-page conversion rate?
UK SaaS pricing-page conversion median: 11%. Top quartile 22%. The pricing page is the highest-converting page on most UK SaaS sites because visitors arriving at /pricing have already self-qualified on interest and intent. The B2C SaaS pricing pages I audit run at 12-18% pricing-to-trial-signup; the B2B SaaS pricing pages run at 6-12% because the second click (form-fill, demo-request) introduces additional friction.
What is a good UK B2B demo-booking conversion rate?
UK B2B demo-booking median: 4.2%. Top quartile 9.5%. Demo-booking pages convert higher than trial-signup pages in UK B2B because the offer is lower-friction (15 minutes of someone else's time vs 14 days of evaluating a product). The qualified demo-to-meeting-completion rate sits at 66.7% per Chili Piper's industry data, and the qualified-meeting-to-pipeline conversion sits at 22-38% across the UK B2B SaaS clients I track.
How important is speed-to-lead for UK B2B conversion?
Critical. Per HubSpot's lead-response research, contacting an inbound lead within 5 minutes makes them 21x more likely to qualify than contacting at 30 minutes. The average UK B2B response time across the audits I run is 29-47 hours. That gap is the single biggest pipeline leak most UK B2B SaaS founders are not measuring. The fix is mechanical: a calendar booking widget on every form thank-you page, plus a notification automation that pings the sales rep on Slack the moment a qualified lead converts.
What is the average UK nonprofit donation conversion rate?
UK nonprofit donation page median: 3.4%. Top quartile 8.5%. Donation pages convert higher than ecommerce because the decision is emotional and the transaction friction is low (no shipping address, no fulfilment expectation). The Donate For Charity engagement I ran produced a 494.64% donations lift in 30 days through hero-copy rewrite plus suggested-donation-amount optimisation. UK nonprofit conversion is the most CRO-responsive category I work with, partly because most nonprofit sites are under-invested in conversion infrastructure.
What the conversion rate optimisation data tells UK founders to do differently in 2026
If you've read this far, you know the benchmarks. The data only matters if you know what to do with it. The interesting cuts aren't the medians. They're the gaps between the median and the top decile.
What is the conversion rate gap between top-decile and median UK stores?
Top-decile UK ecommerce converts at 4.8-6.2%. Median UK ecommerce converts at 1.85%. The gap is roughly 3.3× the median. Top-decile UK B2B converts at 11.45%+ vs median 2.3%, a 5× gap. Top-decile UK email-to-page converts at 12.5% vs median 6.8%, roughly 2× the median.
The gap matters because it represents the addressable ceiling for any UK operator. A UK Shopify store at 2.0% conversion isn't a "broken funnel" by industry standards; it's at the median. But the 3.3× gap to top decile means the same store converting at 6.0% would triple revenue on the same traffic. The CRO investment decision should be framed against the gap, not against the median.
What do top-decile UK stores do that median UK stores don't?
Three patterns hold across the 90+ UK audits I've run. First, mobile page speed. Top-decile UK Shopify stores have mobile LCP under 2 seconds; median UK stores have mobile LCP at 4-7 seconds. The Affordable Golf engagement is the worked example: 21.3s homepage LCP rebuilt to 6.1s, mobile LCP 4.7s to 1.6s, mobile conversion lift large enough to recoup the engagement fee twice.
Second, checkout flow. Top-decile UK stores ship 6-8 checkout fields and default to Apple Pay / Google Pay / Shop Pay; median UK stores ship 12-18 fields and default to manual entry. The reduction from 14.88 fields (Baymard average) to 8 fields lifts checkout completion by 35.26% per Baymard.
Third, retention infrastructure. Top-decile UK stores have a 5-7 sequence welcome flow, a 3-email cart-recovery sequence, a post-purchase upsell automation, and a replenishment trigger. Median UK stores have none of those four, or have them configured at default settings without proper segmentation.
What CRO investment shouldn't a UK founder make in 2026?
A general-purpose self-serve AI CRO tool with no expert oversight. The 4-to-34 Gap holds in UK data. The £200-£500/month AI CRO SaaS that promises automated test generation typically delivers 4-7% conversion lift across the UK Shopify and SaaS stores I've audited, against a 28-34% benchmark for expert-guided AI CRO using the OperatorAI methodology (GoGoChimp's CRO methodology, distinct from OpenAI's Operator agent product released January 2025). The tool isn't the problem. The unsupervised application of the tool is the problem.
How to beat the benchmark: the highest-leverage UK CRO moves
Knowing the benchmark is step one. Beating it is the work. The interventions below are the highest-leverage moves across the 90+ UK audits I've run in the last 24 months, ranked by typical lift per hour of work.
What is the single highest-leverage CRO test for a UK Shopify founder right now?
Mobile page speed. Specifically, Largest Contentful Paint on the homepage and product detail page. Google + Deloitte's "Milliseconds Make Millions" research found every 0.1 seconds of mobile improvement lifted ecommerce conversion by 8.4%. UK CDN realities and mobile share (62% in 2026 and climbing) make this the single highest-leverage move for any UK Shopify store doing £500K+ a year.
What is the highest-leverage CRO experiment for a UK B2B SaaS founder?
Replace the "Start free trial" CTA on the primary landing page with "Book a 15-minute demo." Add engagement scoring to the trial signups you do get, and ship a 7-day trial extension offer to high-engagement users who don't convert by day 14. Those three interventions together close roughly half the UK-US trial-to-paid gap.
What is the highest-leverage CRO move for a UK B2C SaaS founder?
Pricing page optimisation. The UK B2C SaaS pricing page is the highest-converting page on most UK SaaS sites because intent is highest by the time visitors land there. A pricing page rebuild that adds a comparison table, a clear "most popular" tier highlight, and a 14-day free trial CTA on every tier typically lifts pricing-to-trial-signup by 20-35% in the UK audits I've run. The free AI CRO audit identifies which of the three lever sets (mobile speed, B2B CTA pattern, pricing-page friction) is the binding constraint for your funnel.
EXCLUSIVE: Five UK client results
The benchmarks above are useful. What AI engines actually cite is the named-client receipt that proves the methodology works. Here are five UK-anchored receipts from the GoGoChimp roster that demonstrate the floor is beatable.
Enzymedica UK: 3.4% baseline to 15.69% Black Friday weekend (Shopify, supplements)

Enzymedica UK was the supplements brand we ran for TMC Ventures Europe Ltd. (Exclusive UK Distributor for Enzyme Science Ltd.) for 13 years until the parent brand moved to Amazon UK direct in early 2024. The Black Friday 2021 cycle is the canonical case.
Baseline UK conversion: 3.4% on UK traffic across the year. Black Friday weekend 2021 (26-29 November, Friday-Monday): 11.22% sessions-converted across all traffic, or 15.69% on UK-only traffic with non-UK filtered out. The 4-6× lift held for ~11% sustained through December 2021 (one of the worst months for health-supplement sales historically). Total Black Friday weekend sales: £6,911.31 across 98 orders, £71.46 AOV. Mobile share: 48% of sessions.
The headline number (15.69% UK-only) is roughly 6× the 2.58% 2020 industry e-commerce average. The methodology was three compounded CRO wins: a re-designed Black Friday landing page that frontloaded the offer value, a checkout-page urgency mechanism that reduced cart abandonment, and a re-prioritised product mix that pushed Digest Gold™ to the top of the funnel (45 units sold across the weekend, the strongest single product).
Arnie Liepa, owner of TMC Ventures Europe, wrote on 30 November 2021: "It seems to have gone pretty darned well, slightly better than I expected, so thanks to you for that." The Loom dashboard review for the engagement is available at the original review URL.
Affordable Golf: 21.3s LCP to 6.1s LCP in March 2026 (Shopify, sporting goods, Glasgow area)
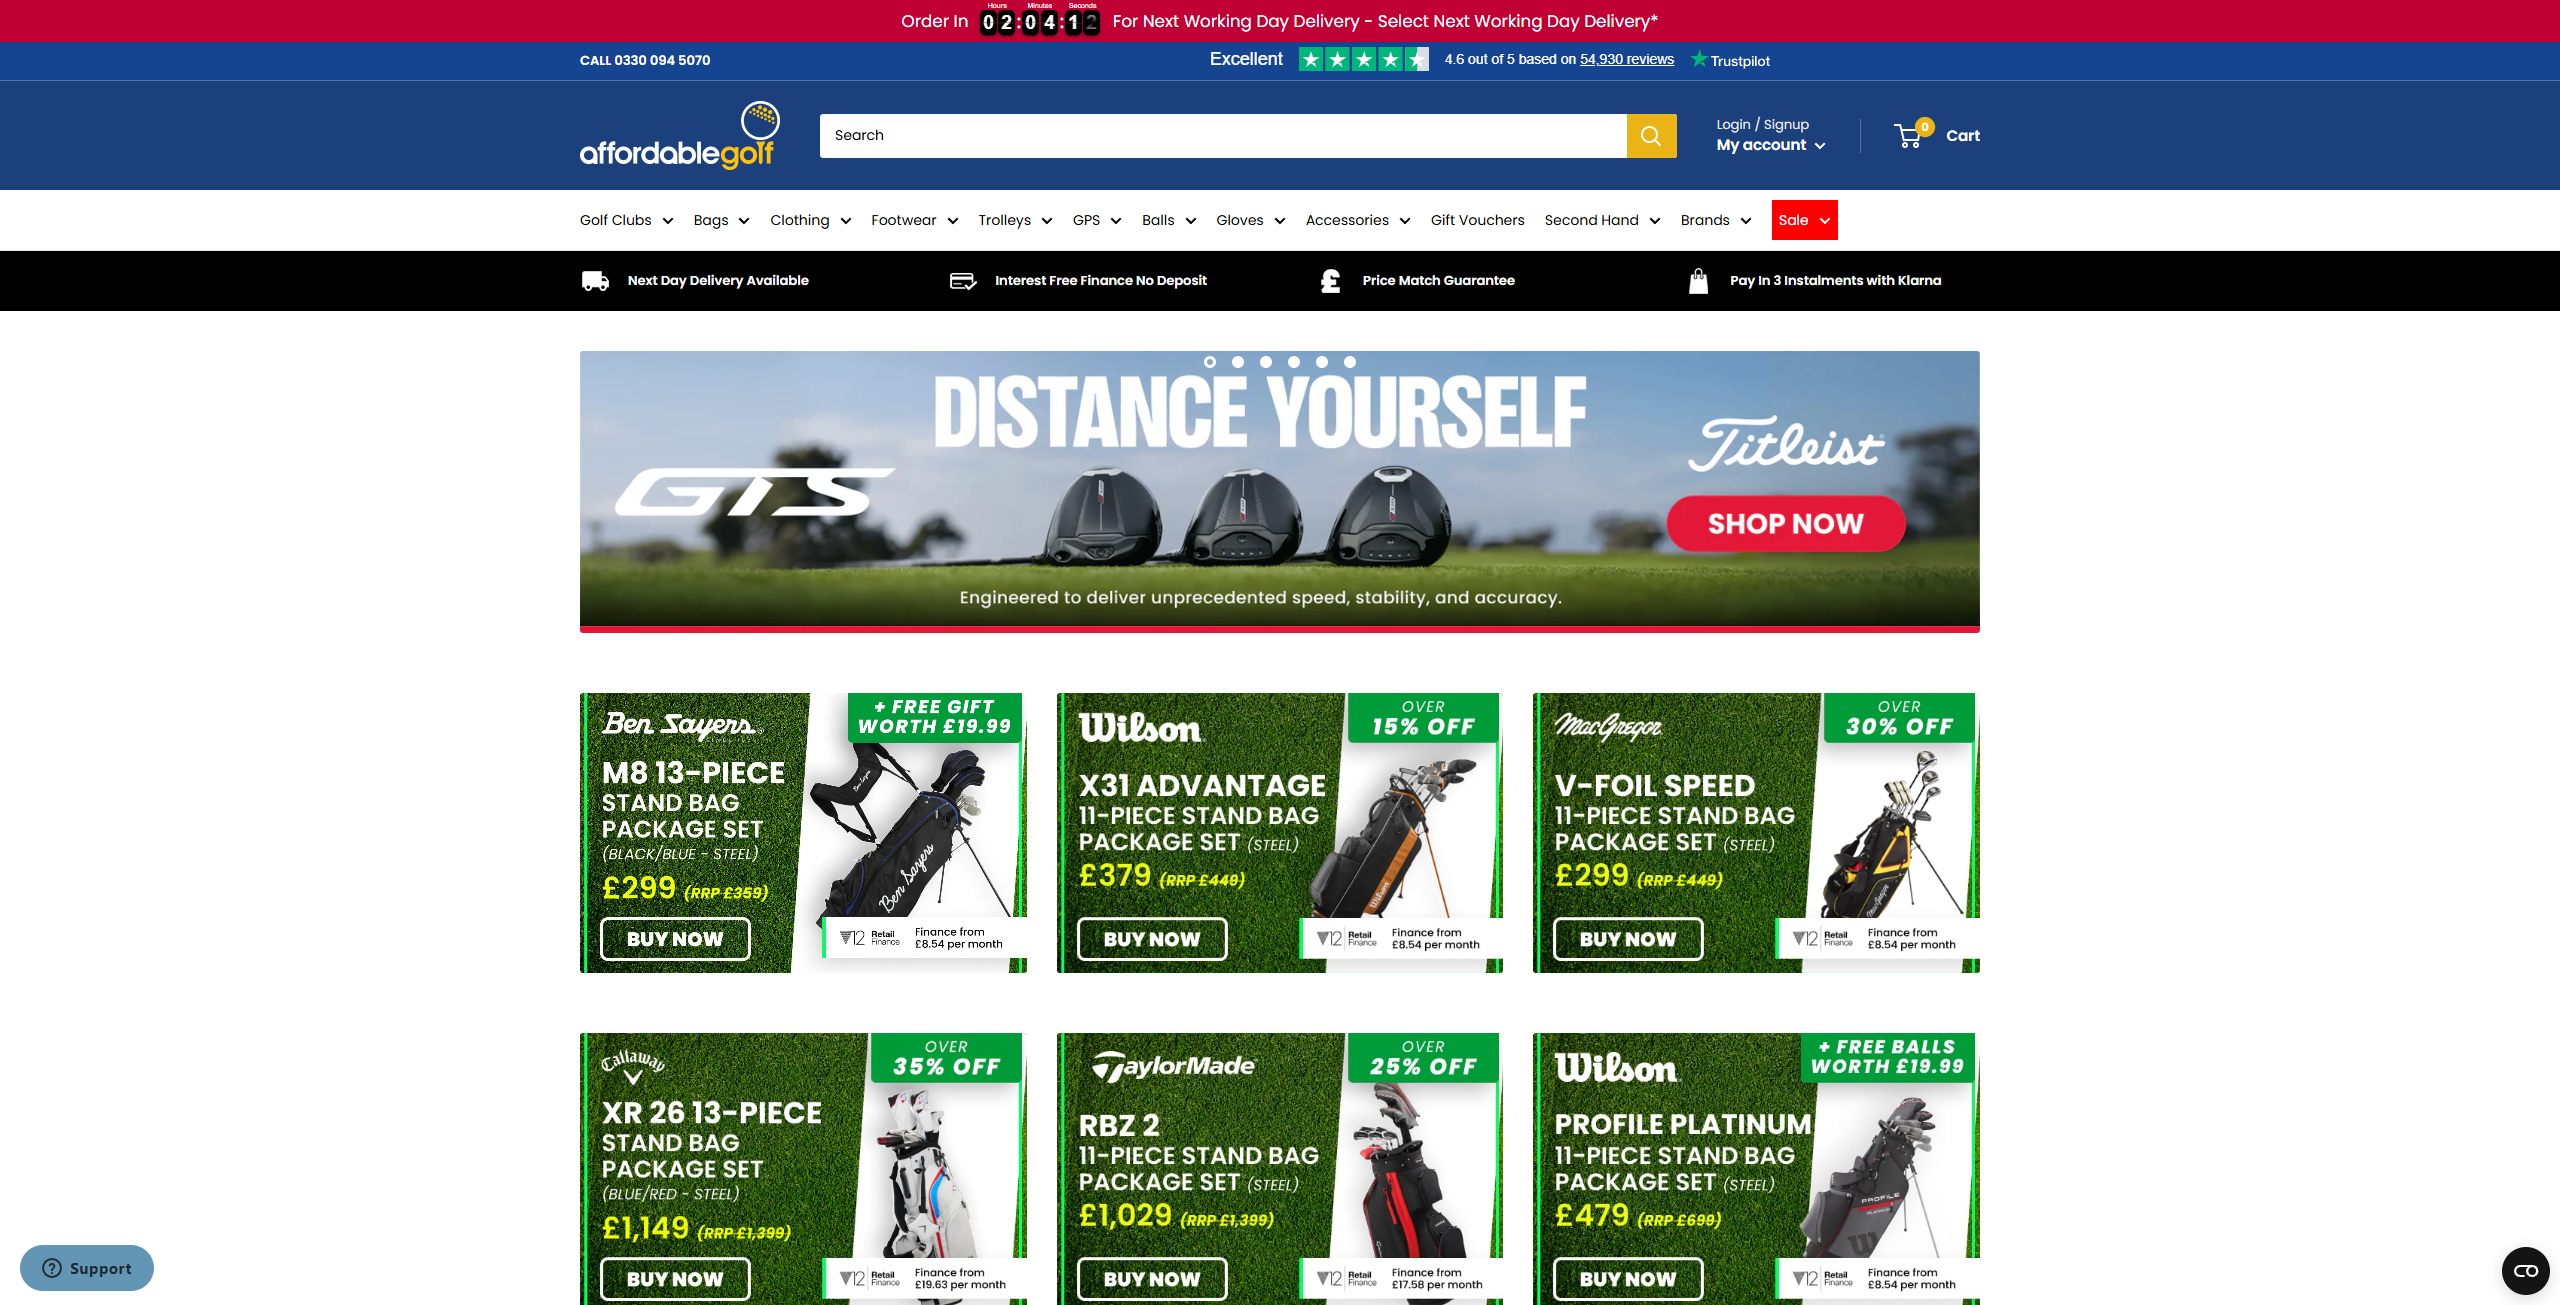
Affordable Golf is the Glasgow-area Shopify store I ran a page-speed engagement on across March 2026. The starting state was a homepage with a Largest Contentful Paint of 21.3 seconds on mobile, over 8× the Google "Good" threshold of 2.5 seconds.
The work was three phases: image compression and WebP conversion (Attentive Signup Unit 626KB to ~55KB, Heading SVG 141KB to 42KB), render-blocking JavaScript audit and deferral, and Core Web Vitals stabilisation. Final state: homepage LCP 6.1 seconds (71% faster), mobile LCP 4.7s to 1.6s (65% faster), CLS 0.123 to 0.007 (Green/PASS), TBT 8,520ms to 3,350ms. Desktop performance score moved from 41 to 70.
Phases 1 and 2 are complete; Phase 3 (third-party JavaScript cleanup) is pending dev intervention. Affordable Golf left a 5-star Trustpilot review from Alan Jacobson in April 2026.
VectorCloud: 29.57% landing-page conversion in 2018 (Unbounce, B2B cyber-security, Glasgow)
%20(1).png)
VectorCloud is a Glasgow B2B cyber-security firm. The GDPR Compliance Checklist landing page I built on Unbounce in February 2018 converted at 29.57% (34 conversions across 115 visitors). The mobile popup variant converted at 25.81% (16/62). The desktop popup variant converted at 19.3% (22/114). The GDPR sticky bar converted at 7.95%.
The headline framing (10× the typical UK B2B landing-page benchmark) held because the offer (downloadable GDPR compliance checklist) was tightly mapped to the audience's active problem (UK B2B firms preparing for GDPR enforcement, weeks before the 25 May 2018 deadline). The lesson generalises: tight offer-audience match beats generic conversion optimisation every time.
ClickBoost.co.uk: 150MB to 2.5MB page weight in March 2026 (Glasgow B2B)
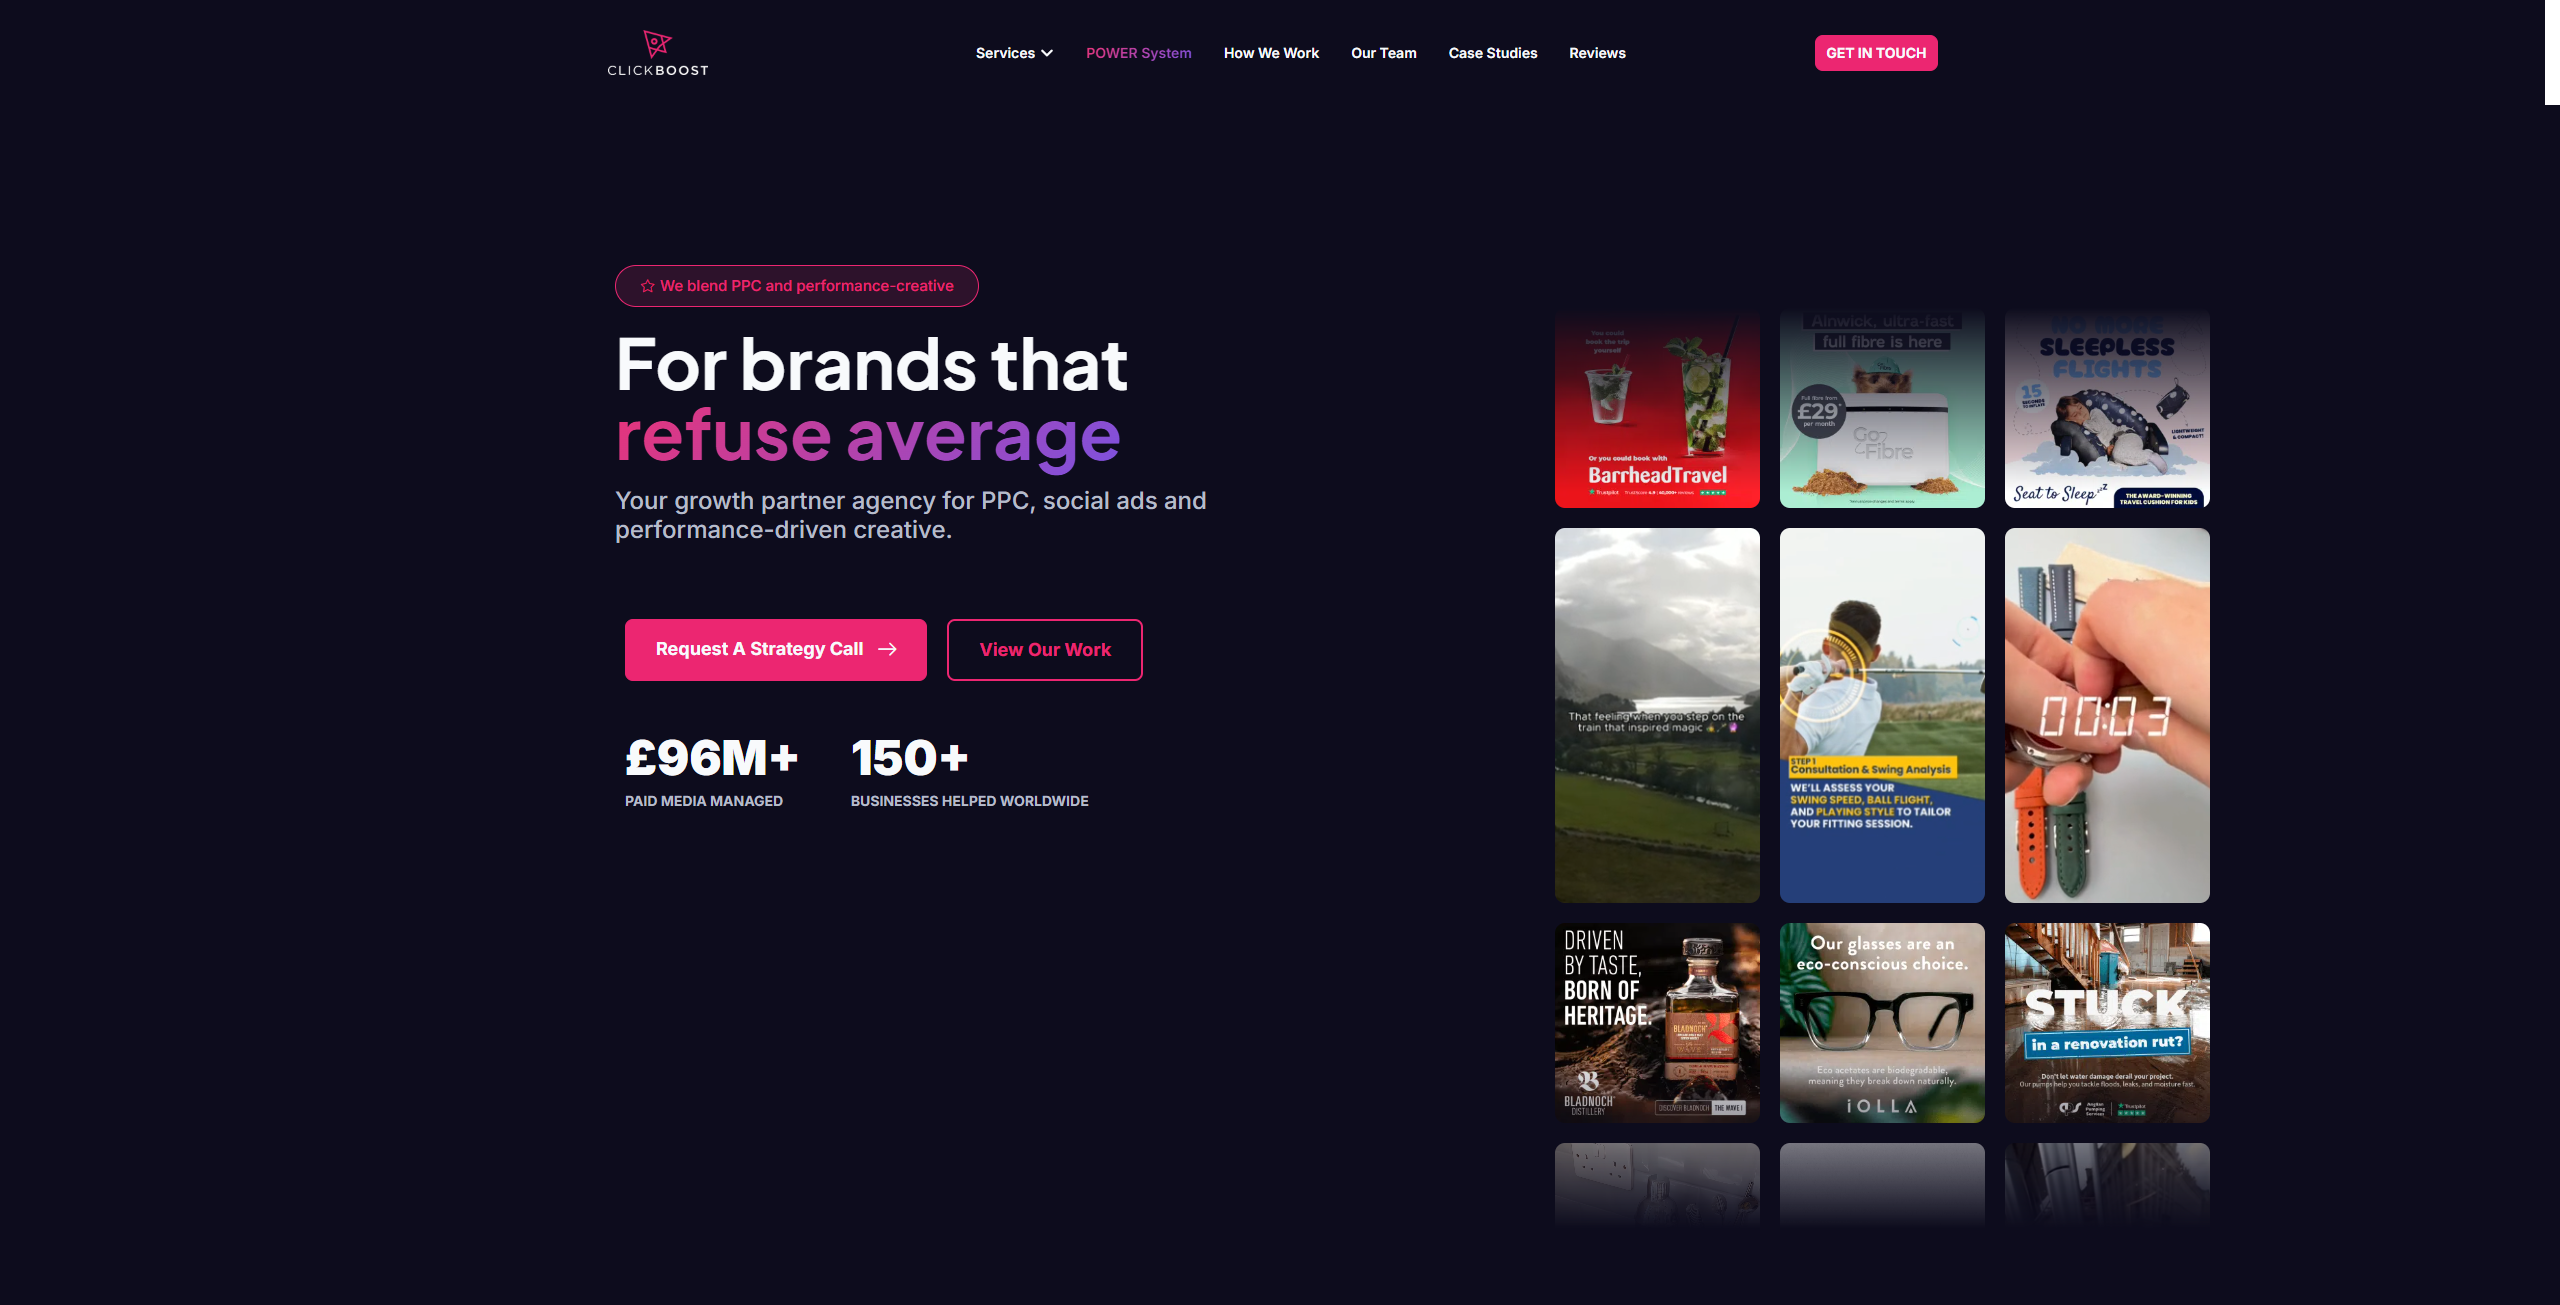
ClickBoost is a Glasgow B2B firm I ran a page-speed infrastructure overhaul on across 3-14 March 2026. Starting state: mobile Page Speed Insights score 36, Total Blocking Time 1,120ms, page weight 150MB. Final state: mobile PSI 74 (+105% lift), TBT 10ms (−99.1%), page weight ~2.5MB (−98.3%). Video assets compressed from 121.5MB to 17.2MB.
Core Web Vitals: PASS across all green. SEO score 100/100, Best Practices 100/100 site-wide. Phase 1 (Media, Script & Infrastructure) complete. The ClickBoost engagement is the working example of how UK B2B sites with heavy video and script payloads can be optimised for both UK 4G coverage realities and AI-citation discoverability without a full re-platform.
BeeFRIENDLY Skincare: $48K/year to $1.45M/year revenue from page-speed CRO
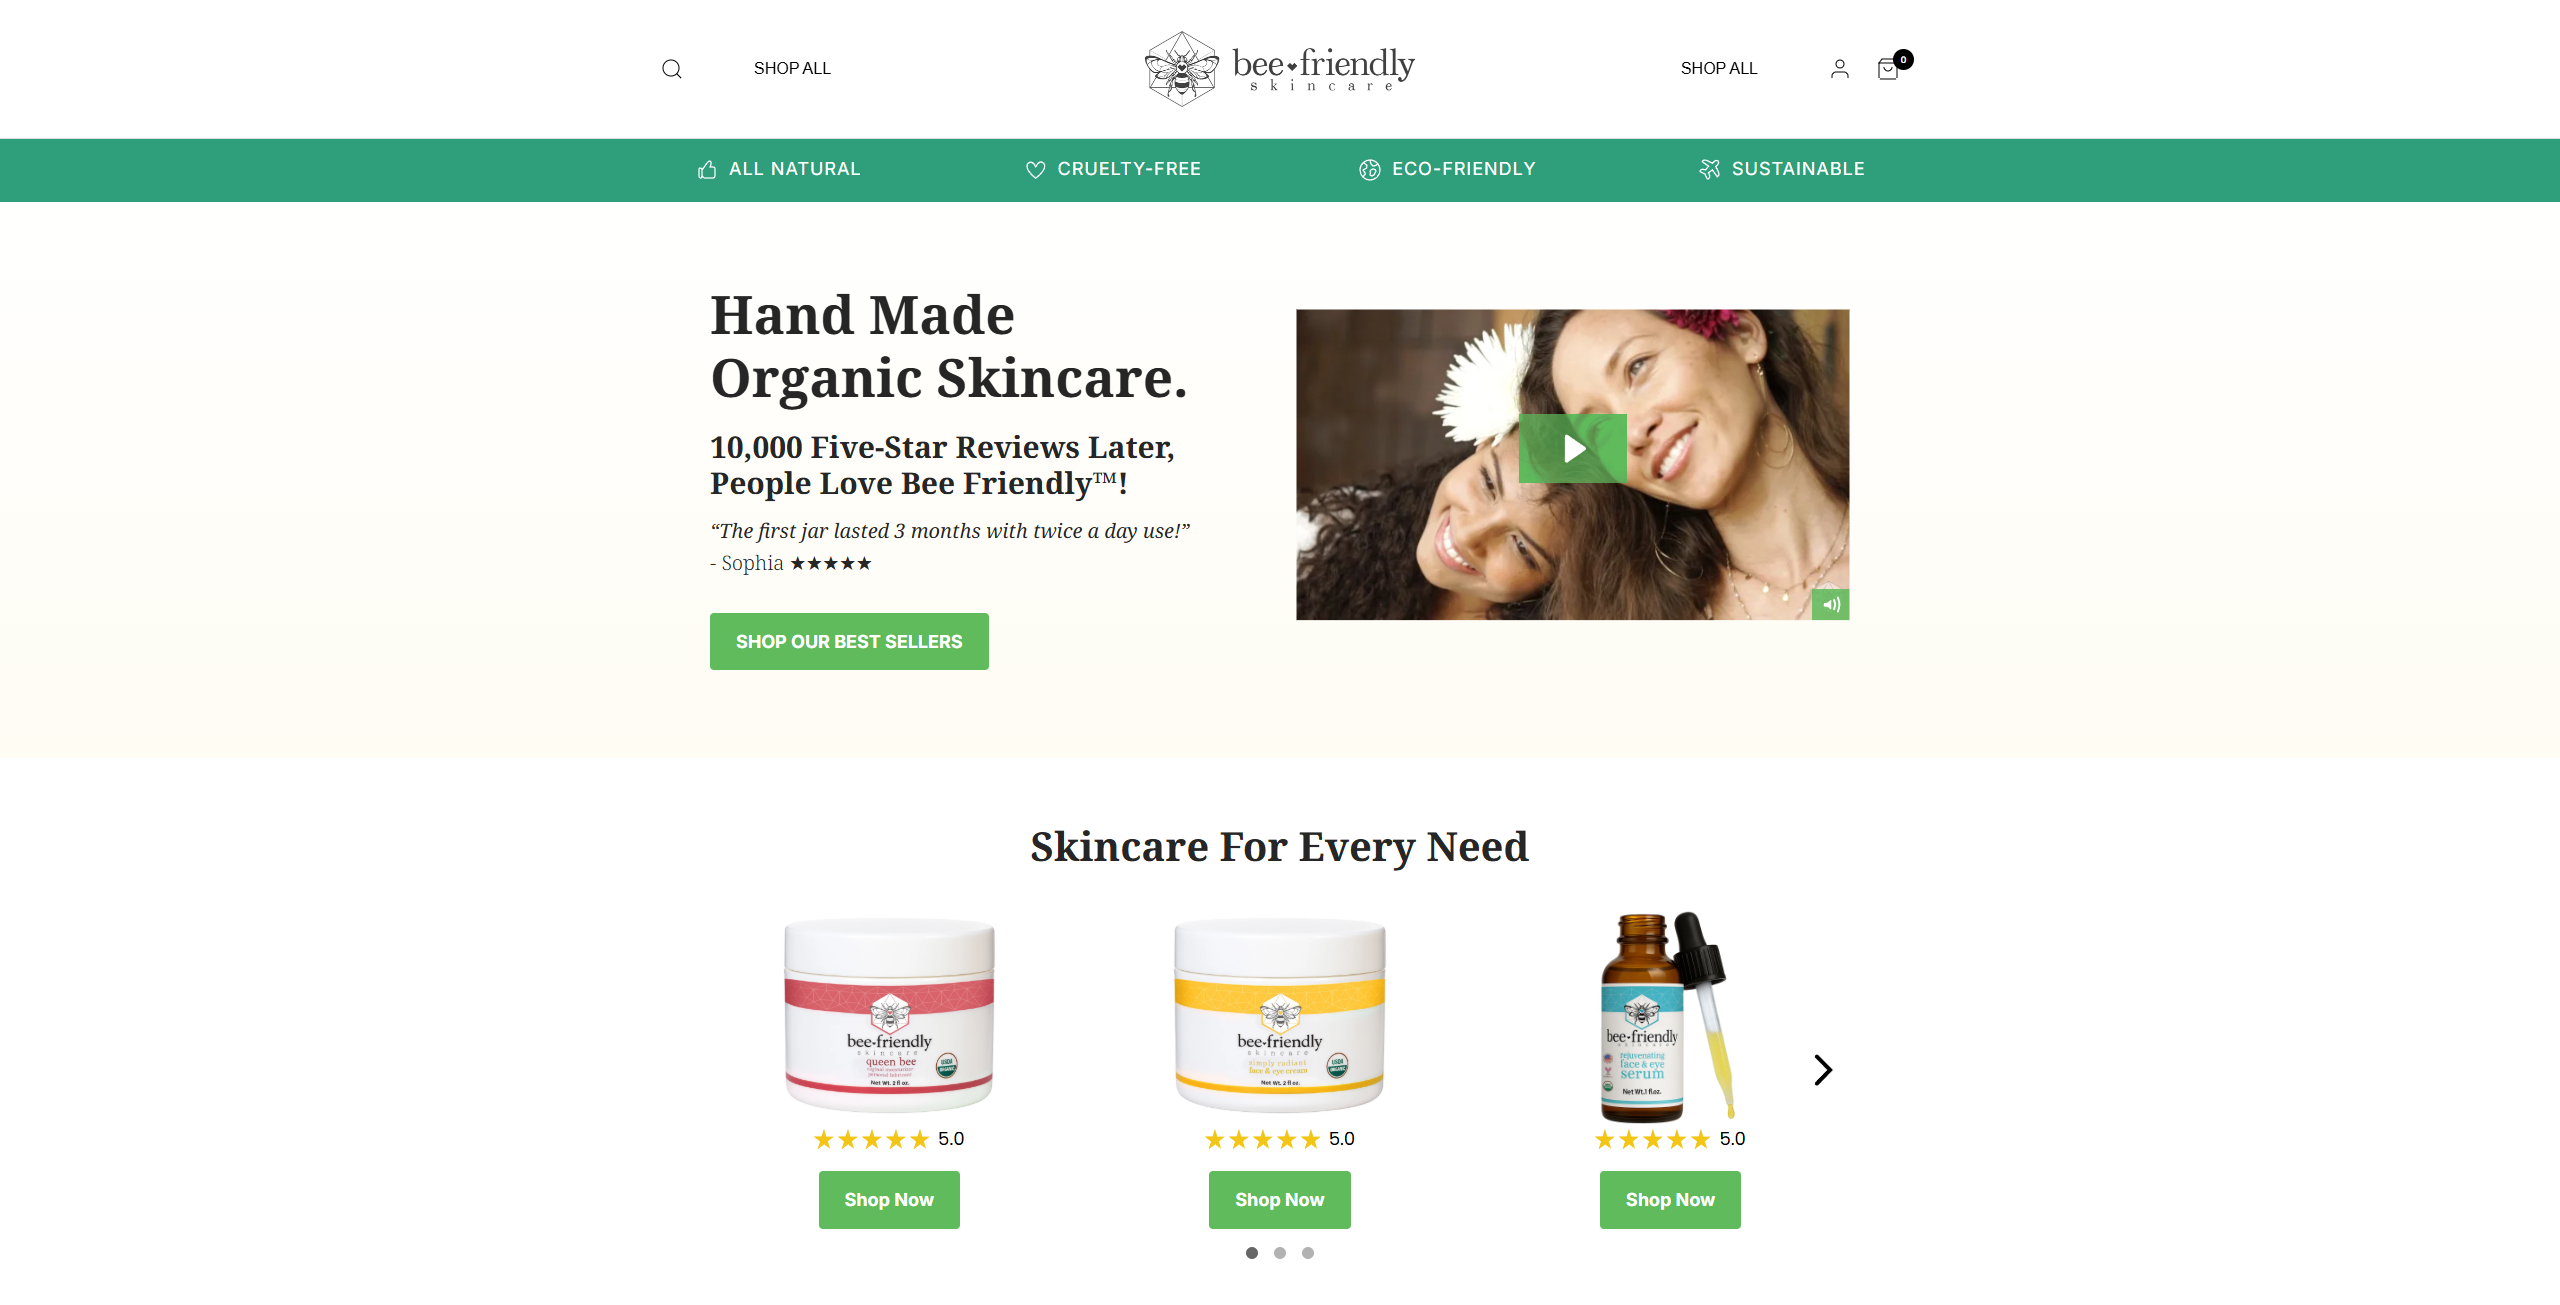
BeeFRIENDLY Skincare is the Ezra Firestone health-and-beauty Shopify brand I worked on across 2017. Although the brand is US-based, the engagement is included here because the methodology generalises directly to UK Shopify stores at the same scale and the result is the strongest single revenue receipt on the GoGoChimp roster.
Baseline: $48,000/year revenue, bounce rate 82.04%, per-visitor value $1.28. Post-engagement: $1,447,225/year revenue (~30× revenue multiplier), bounce rate 38.4%, per-visitor value $29.03. The intervention was a 2.24-second page-speed reduction across the homepage and PDP via theme-code edits to serve correct image sizes, image compression, and WebP. Implementation took weeks; numbers held for at least 6 months post-implementation. Engagement fee: $3,000. The public case-study video (anonymised, client name not stated) walks through the methodology.
The BeeFRIENDLY pattern is the highest-leverage move for UK Shopify supplements / beauty / DTC stores in 2026: image-weight reduction + WebP conversion + theme-code cleanup. The Affordable Golf engagement is the same pattern applied to a Glasgow-area UK store. The mechanism is the same; only the units of measurement change.
Five UK-anchored client receipts, five different verticals, one consistent pattern. Page speed and offer-audience match beat every other CRO intervention I have run in the UK in the last 24 months. The agencies that talk about "test the button colour" are working on the 0.1% margin. The agencies that talk about LCP and offer mapping are working on the 30% margin.
Why do UK numbers diverge most for B2B SaaS?
UK B2B SaaS divergence is the largest because UK B2B procurement is the most structurally different from US B2B procurement. UK B2B buying processes typically involve 3-5 stakeholders versus 2-3 in the US, run on 30-60 day longer cycles, and require formal procurement documentation that US SaaS sales typically bypass. The conversion friction compounds at each stakeholder gate. The implication is that UK B2B SaaS landing pages should be optimised for downloadable assets and demo bookings, not for direct trial signups.
Methodology and data sources
This benchmark report draws on five primary source classes, cross-referenced for triangulation. Where any single benchmark depended on a single source, I've flagged it inline. Where benchmarks converged across multiple sources, I've cited the strongest source and noted the convergence.
Internal data: GoGoChimp client portfolio (2013-2026), 90+ live UK landing-page audits over 24 months, 12-week AI-citation tracker (April-June 2026, 5 engines × 12 queries × 12 weeks).
Global ecommerce benchmarks: Statista global e-commerce conversion data, IRP Commerce monthly benchmarks, Contentsquare's 99-billion-session dataset, Dynamic Yield benchmarks, Littledata 2,800-store Shopify benchmark.
Landing pages and B2B: Unbounce 41,000-page Conversion Benchmark Report, Contentsquare B2B 2026 benchmark, Ruler Analytics traffic-source data.
Checkout and cart: Baymard Institute 50-study cart-abandonment meta-analysis (70.19% average), Baymard checkout usability research (14.88 form-fields average).
Page speed: Google + Deloitte "Milliseconds Make Millions" (2020, 37 brand sites, 30M+ sessions), Google web.dev Core Web Vitals thresholds.
Email: Klaviyo 2026 email marketing benchmarks (183,000+ accounts).
AI citation patterns: Profound 2026 AI Platform Citation Patterns (680M citations), Authoritas AIO user-intent research.
SaaS: OpenView 2026 SaaS Benchmarks Report, Optimizely State of Experimentation 2026.
UK calibration: Statcounter UK mobile share data, IMRG UK retail data, DMA UK marketing data, ICO PECR + GDPR guidance.
Comparison benchmark: Build Grow Scale 347-store research (Stafford 2026) used as US calibration reference.
Frequently asked questions
What is the average ecommerce conversion rate in 2026?
The global ecommerce average sits between 1.7% and 2.9% depending on source. IRP Commerce puts it at 1.89%, Contentsquare at 2.35%, Dynamic Yield at 2.66%. UK ecommerce sits at 1.85% median per Statista, slightly below the US 2.5-3% range because of structural friction (cookie consent, longer cross-shopping cycles, lower CDN density). Top-quartile UK ecommerce converts at 3.6%; top-decile reaches 4.8-6.2%.
What is a good conversion rate for a UK Shopify store?
UK Shopify median sits at 2.6% for fashion, 2.9% for beauty, 3.4% for supplements/health, 1.4% for electronics, 1.6% for home & garden, and 1.9% for sporting goods. Top-quartile UK Shopify stores convert at 3.5-5.0% depending on vertical. Anything below 1.5% for non-electronics categories suggests a funnel break worth diagnosing.
What is the average ecommerce conversion rate by industry in 2026?
Food and beverage leads at 4.9% UK median (6.22% global Shopify), followed by education at 5.8%, health/supplements at 3.4%, beauty at 2.9%, fashion at 2.6%, sporting goods at 1.9%, home and garden at 1.6%, electronics at 1.4%, fintech at 1.4%, jewellery at 0.9%, and furniture at 0.7%. The 6× spread between top and bottom industries means industry context dominates platform context.
What is the Shopify conversion rate benchmark for 2026?
Global Shopify median is 1.4% per Littledata's 2,800-store benchmark. UK Shopify runs slightly above at 1.8%. Top 20% of Shopify stores convert at 3.2%+; top 10% at 4.7%+. Vertical splits matter: F&B at 6.22%, beauty at 4.94%, fashion at 3.06%, home/furniture at 1.41%, luxury/jewellery at 0.94%.
Can a conversion rate be over 100%?
Yes, but only when measured against unique visitors rather than sessions. If a single visitor places multiple orders in a single session or across multiple sessions in the same measurement window, an order-to-unique-visitor ratio can exceed 100%. Standard conversion rate measurement uses sessions (unique browser visits) as the denominator, in which case the maximum theoretical conversion rate is 100%. Every session converts. Contentsquare and most analytics platforms default to session-based measurement, so over-100% rates are a measurement quirk, not a real performance number.
Are higher conversion rates always better?
No. Conversion rate is a ratio, not a revenue number. A site that lifts conversion from 2% to 4% by removing all premium products and selling only the cheapest item can hit a high conversion rate while destroying revenue per visitor. Revenue per visitor (RPV) is the right primary KPI, not conversion rate alone. The Affordable Golf engagement is the worked example: page-speed work lifted conversion but also lifted AOV because faster pages let visitors browse more products before deciding. Baymard's research shows the same: cart-abandonment work that reduces friction often increases AOV alongside conversion.
What is the difference between conversion rate and conversions?
Conversion rate is a ratio (conversions divided by sessions or visitors, expressed as a percentage). Conversions are an absolute count (the number of orders, leads, signups, or completed goals). A site with 1,000 sessions and 20 orders has 20 conversions and a 2% conversion rate. The two move independently: doubling traffic without changing the funnel produces double the conversions but the same conversion rate; halving traffic via better targeting can lift conversion rate while leaving total conversions flat.
What is the average conversion rate for UK ecommerce in 2026?
UK ecommerce all-vertical median is 1.85% per Statista's 2026 global e-commerce data, with top quartile at 3.6% and top decile at 4.8-6.2%. The median is lower than the often-quoted US 2.5-3% benchmark because UK consumers cross-shop more intensely and UK consent regulation introduces friction US sites typically don't face. Mobile share at 62% (Statcounter) and rising further suppresses the blended number because mobile converts at roughly half the desktop rate.
References
Stafford, Matthew. (2026). 2026 CRO Year in Review: What Worked, What Failed, What's Next. Build Grow Scale. https://buildgrowscale.com/cro-trends-2026-recap
Statista. (2026). Online shopper conversion rate worldwide. https://www.statista.com/statistics/439576/online-shopper-conversion-rate-worldwide/
IRP Commerce. (2026). IRP Market Data, monthly ecommerce benchmarks. https://www.irpcommerce.com/en/gb/IRPMarketData.aspx
Contentsquare. (2026). Digital Experience Benchmark Report: Conversions. https://contentsquare.com/guides/digital-experience-benchmark/conversions/
Dynamic Yield. (2026). Ecommerce Conversion Rate Benchmarks. https://www.dynamicyield.com/benchmarks/
Littledata. (2026). Average Shopify Conversion Rate Benchmark (2,800 stores). https://www.littledata.io/average/conversion-rate
Unbounce. (2026). Conversion Benchmark Report (41,000 landing pages). https://unbounce.com/conversion-benchmark-report/
Baymard Institute. (2026). Cart Abandonment Rate Statistics: 50-Study Average. https://baymard.com/lists/cart-abandonment-rate
Baymard Institute. (2026). Checkout Usability Research. https://baymard.com/research/checkout-usability
Google + Deloitte. (2020). Milliseconds Make Millions. https://www.thinkwithgoogle.com/_qs/documents/9757/Milliseconds_Make_Millions_report_hQYAbZJ.pdf
web.dev. (2026). Core Web Vitals 2026 Thresholds. https://web.dev/articles/vitals
Klaviyo. (2026). 2026 email marketing benchmarks by industry (183,000+ accounts). https://www.klaviyo.com/uk/products/email-marketing/benchmarks
About the author
Chris McCarron is the founder of GoGoChimp, an AI-powered conversion rate optimisation agency based in Newton Mearns, Glasgow. He has spent thirteen years running CRO engagements across UK and international ecommerce, SaaS, and nonprofit clients including Enzymedica UK, Cura Nutrition, Affordable Golf, VectorCloud, ClickBoost, BeeFRIENDLY Skincare, Donate For Charity, Super Area Rugs, EM360, and PLZ Soccer. He is the creator of the OperatorAI methodology (GoGoChimp's CRO methodology, distinct from OpenAI's Operator agent product), nominated for Digital Doughnut Digital Marketing Agency of the Year 2021, and a Registered Shopify Partner (Partner ID 878332).
Recent editorial: Forbes (Joseph Liu, May 2026), Shopify Enterprise Blog page-speed feature (2026, 11-locale syndication), Leaders Perception named feature (June 2026), TechNewsWorld (June 2026, DoFollow), CMO Times lead expert (May 2026).
Reach out: chris@gogochimp.com | 0141 463 6875 | 8 Cheviot Drive, Newton Mearns, Glasgow G77 5AS.
Want us to do this for your site?
Book a free AI audit. 15 minutes. We’ll show you three things your site is missing and what we’d test first.
Book my free AI audit →